Sold
$539,500 $230/sqft
421 Skyland Avenue
Charlotte, NC 28205
4 bd · 2 ba · 2,346 sqft · 1946 · DOM: 277 d
Elizabeth Acres sits in Charlotte’s inner southeast edge with a distinctly established, in-town feel.
Community overview based on MLS listing data for Elizabeth Acres, Charlotte
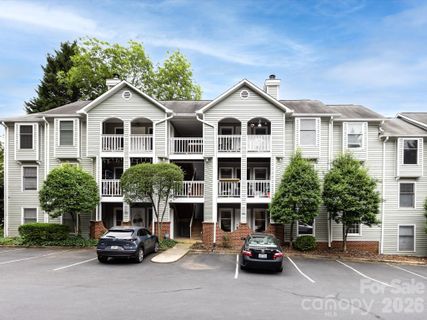
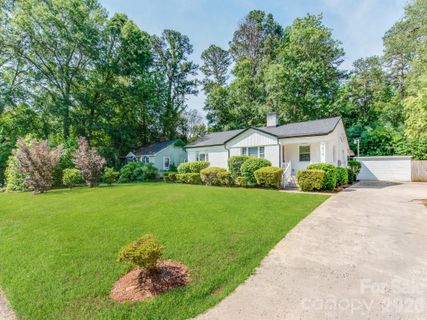
Elizabeth Acres sits in Charlotte’s inner southeast edge with a distinctly established, in-town feel. The streets here mix older cottages, classic bungalows, and newer custom builds, so the neighborhood reads as layered rather than uniform. You’ll see a range of eras and price points, but the common thread is a residential setting close to the city’s core, with plenty of momentum around Skyland and Orange.
"Close to the center city energy, with a residential character that still feels rooted and practical."
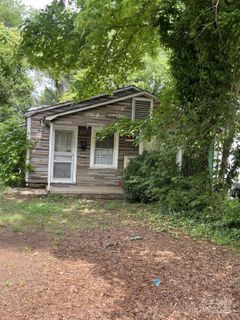
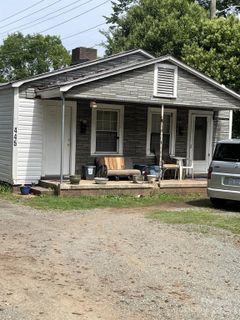
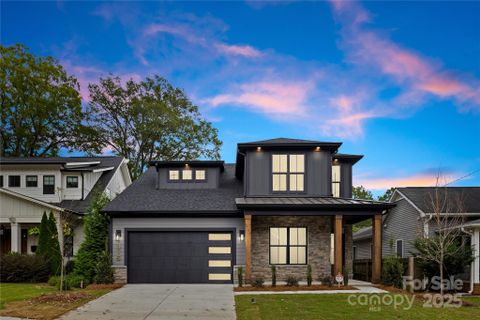
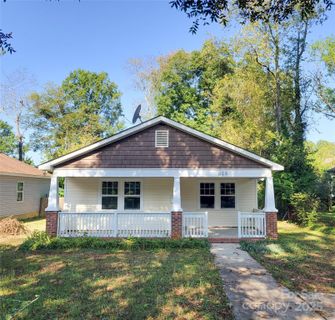
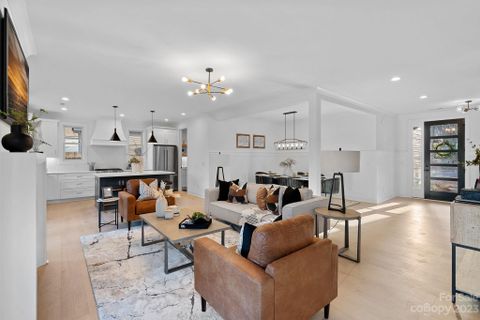
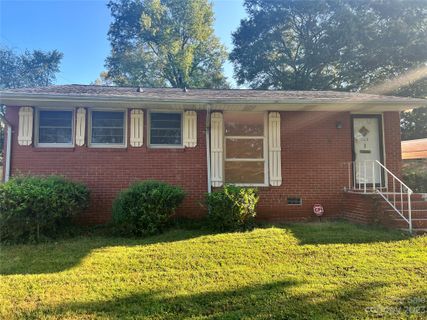
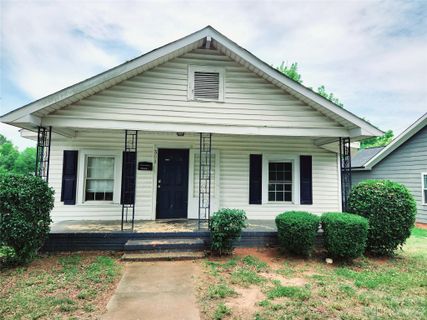
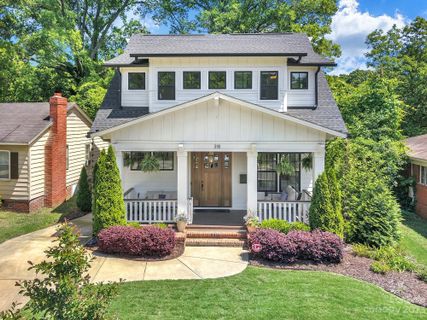
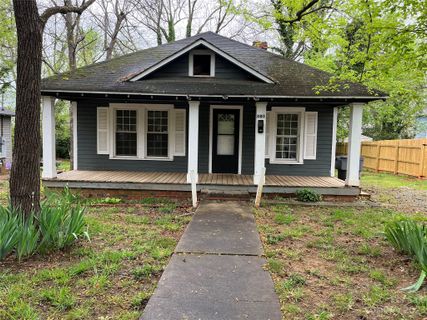
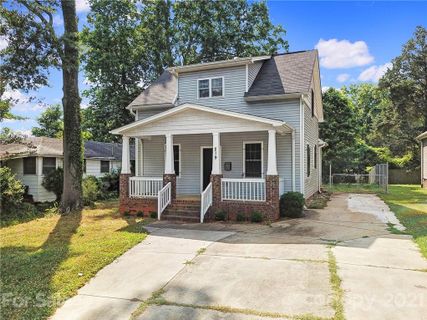
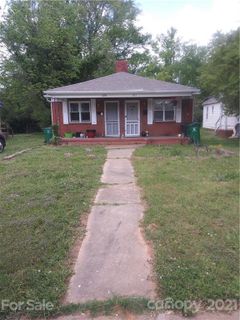
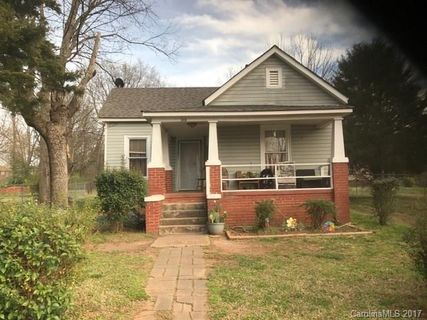
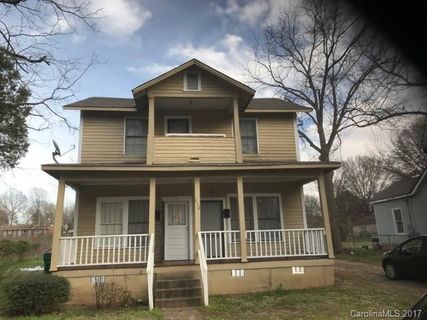
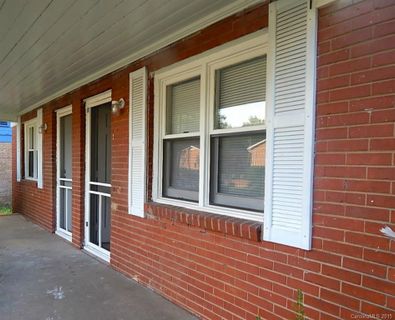
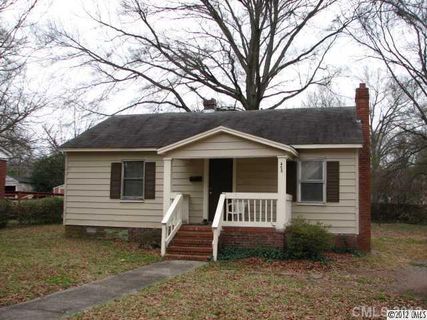
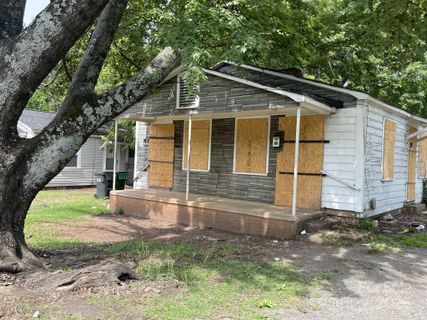
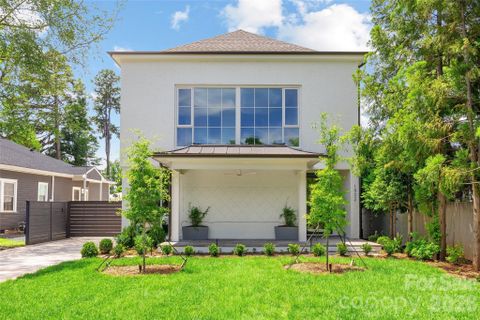
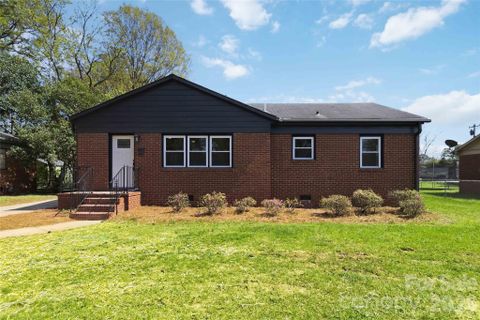
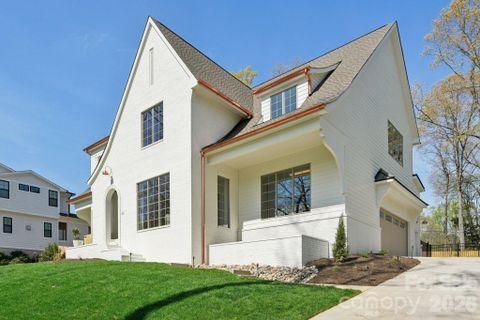
This is a single-family community at heart, and the housing stock tells a clear story. Early homes from the 1920s and 1930s still anchor the area, while more recent construction has added modern farmhouse and craftsman-inspired homes with open layouts, covered porches, fenced yards, and upgraded kitchens. Many homes feature brick exteriors, and the newer properties lean into architectural detail with high ceilings, glass doors, and expanded outdoor living spaces.
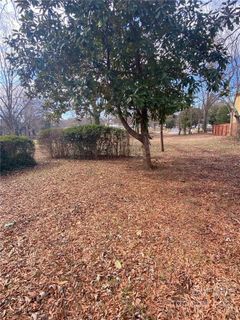
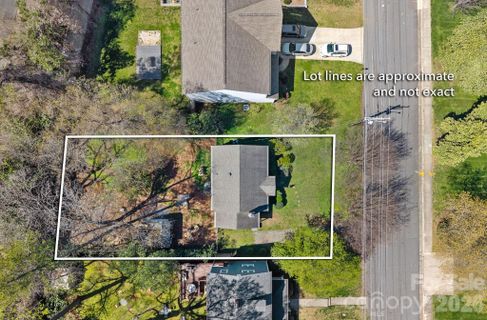
Lot sizes are generally manageable, which gives the neighborhood a more intimate streetscape and keeps maintenance straightforward. The overall feel is urban-residential: not sprawling, not overly formal, and very much shaped by its proximity to Charlotte’s central neighborhoods.
Daily life here is tied to convenience. Listings repeatedly point to quick access to shopping, restaurants, medical facilities, parks, greenway access, and local museums. The area also connects naturally to nearby neighborhoods like Elizabeth, Eastover, Cotswold, Myers Park, and Plaza Midwood, giving residents a wide choice of dining and errands without a long drive.
"A neighborhood for people who want city access, familiar streets, and a wide mix of nearby destinations."
There is no consistent community amenity package to center the story around, but the surrounding district fills that role well. The appeal is less about gated features and more about being near the places people actually use day to day.
Elizabeth Acres is best understood as part of Charlotte’s central eastside corridor, close to Uptown and within easy reach of Midtown, Cotswold, SouthPark, and Plaza Midwood. Several listings describe the area as minutes from Uptown Charlotte, with one noting a 5-minute trip to uptown and another emphasizing a short walk to Mint Museum Randolph and Briar Creek Greenway. Public remarks also place the neighborhood close to the hospital, Starbucks, and the broader Plaza Midwood activity area.
School references consistently point to Alexander Graham Middle and Myers Park High, with Myers Park High mentioned repeatedly in listing remarks and community data. That school alignment is one of the neighborhood’s defining anchors, especially for buyers looking for an established Charlotte address with central-city convenience and familiar school names.
Palmetto Park Realty Team · Charlotte
Ask about Elizabeth Acres — we answer fast
See what it's worth — your home's own sale history plus recent Elizabeth Acres sales, free.
What's my home worth?Communities similar to Elizabeth Acres
 2.7 mi
 Myers Park Manor, Charlotte
2 active · $337,500
 0.8 mi
 Elizabeth, Charlotte
16 active · $996,450
 1.6 mi
 Eastway Park, Charlotte
2 active · $362,500
 0.9 mi
 Echo Hills, Charlotte
3 active · $440,000
 2.8 mi
 Shenandoah Park, Charlotte
2 active · $350,000
 2.5 mi
 Sherwood Forest, Charlotte
8 active · $909,999
Closed sales from MLS history for Elizabeth Acres, Charlotte
Elizabeth Acres median sale price is $330,000.
+1 outside price range.
The Elizabeth Acres real estate market shows balanced market conditions. Homes typically sell within 52 days. With 0 active listings and 4 homes sold in the past year, a healthy balance exists between buyers and sellers.
Free account needed — create one to continue viewing homes.
Members see everything — free👋 Still browsing Elizabeth Acres?
Full photos, price history, and every active & pending home in Elizabeth Acres with a free account.
Palmetto Park Realty Team
Check your messages
We sent a code to .
Verify your number and we'll text you price drops and new Elizabeth Acres listings. 1–2 texts a month, stop anytime.
Enjoy full access to this home and every home on Palmetto Park.