Active
New
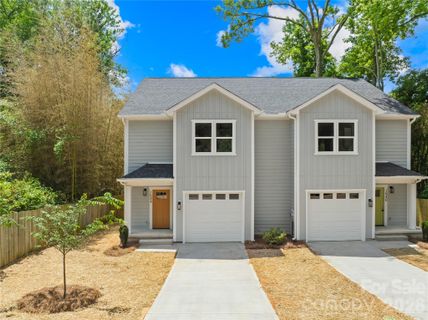
$360,000 $222/sqft
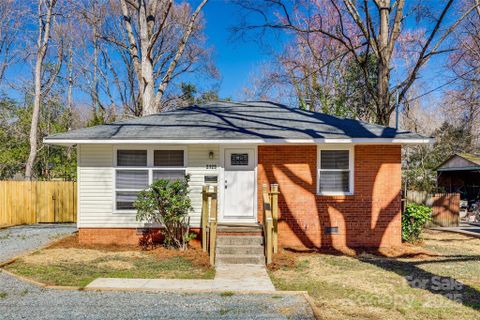
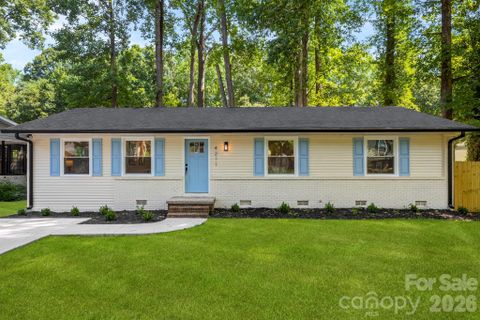
1940 Purser Drive
Charlotte, NC 28215
3 bd · 2 ba · 1,624 sqft · 2026 · 4 d ago
Garage
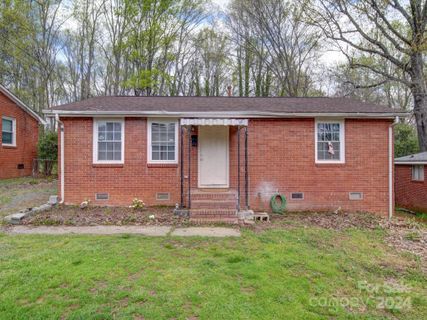
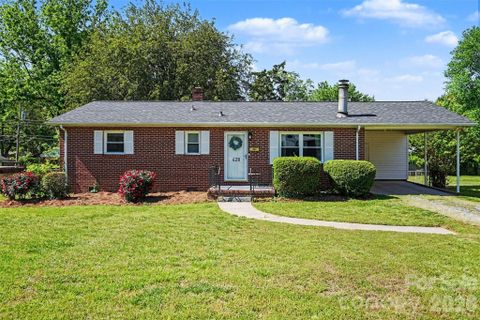
Eastwood Acres has the feel of an established Charlotte pocket that has steadily refreshed itself without losing its 1950s and early-1960s character.
Community overview based on MLS listing data for Eastwood Acres, Charlotte
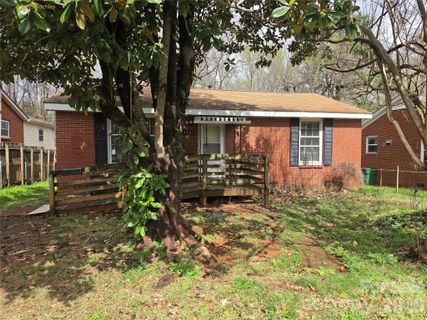
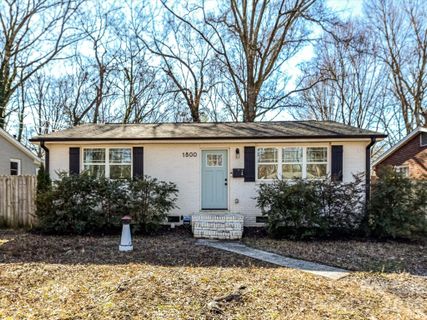
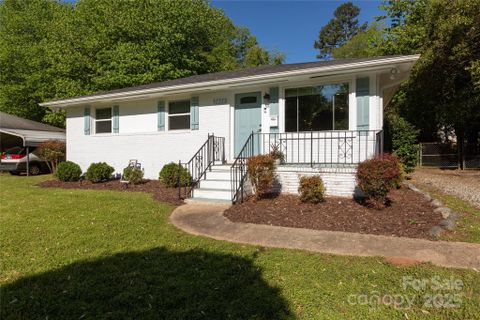
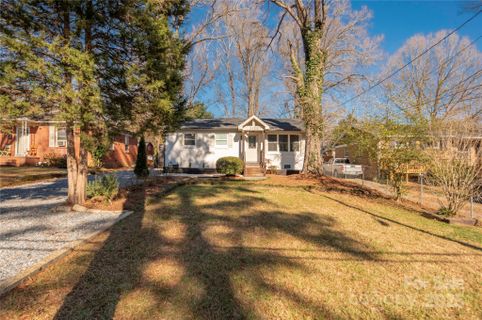
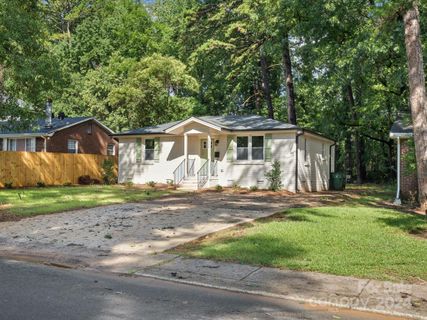
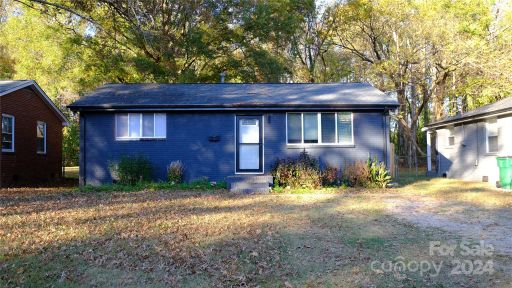
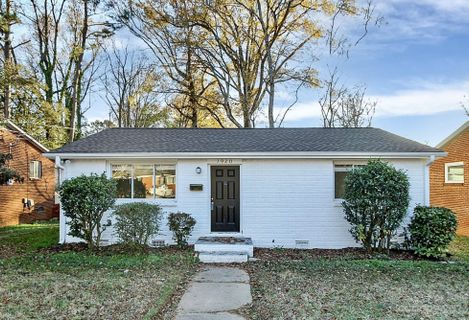
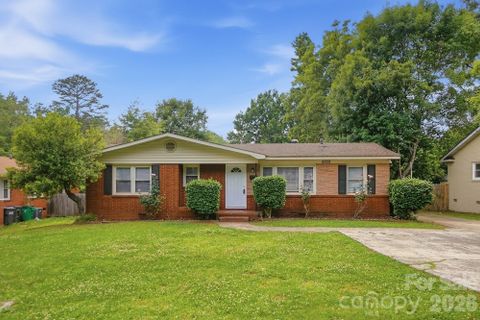
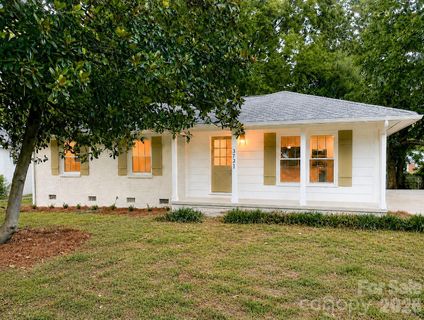
Eastwood Acres has the feel of an established Charlotte pocket that has steadily refreshed itself without losing its 1950s and early-1960s character. The streets are lined with modest single-family homes, and many have been thoughtfully updated with newer roofs, windows, kitchens, and flooring. Brick shows up often enough to give the neighborhood a classic look, while fenced yards, long driveways, and generous front or back outdoor space keep the setting practical and lived-in.
"Classic ranch homes and updated interiors give Eastwood Acres a grounded, easygoing Charlotte feel."
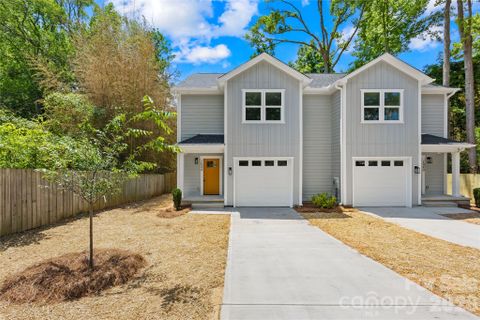
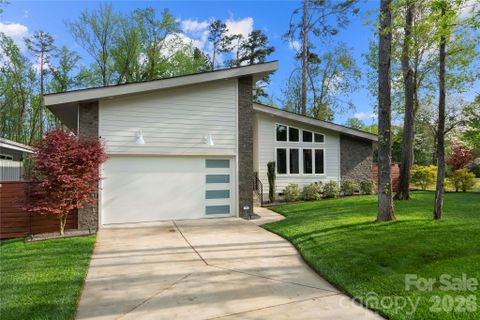
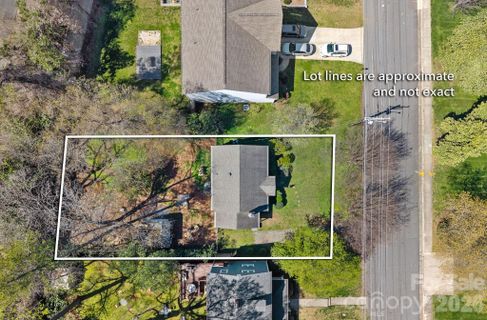
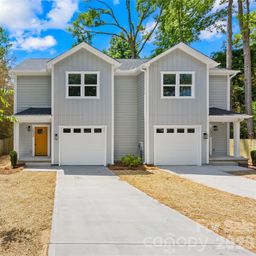
Most homes here are compact ranches and one-story residences, with a few larger floor plans and occasional finished lower-level space. The homes generally sit on manageable lots, averaging just over a fifth of an acre, which helps the neighborhood feel open without becoming sprawling. Inside, the most common updates lean toward quartz or granite counters, stainless appliances, LVP or hardwood floors, modern lighting, and renovated baths. That mix of original construction and newer finishes gives Eastwood Acres a straightforward charm: not overly polished, but clearly cared for.
Outdoor space is a recurring strength. Fenced backyards, patios, decks, sheds, and storage rooms appear often, and several homes emphasize room for gardening, entertaining, or simply spreading out. The overall impression is of a neighborhood that works well for buyers who value usable space and a home that can be enjoyed immediately or improved over time.
Eastwood Acres is more about the home and its setting than a formal amenity package. Daily life here tends to revolve around the house itself, the yard, and the nearby Charlotte destinations that sit just beyond the neighborhood edge. The area’s appeal comes from convenience: quick access to major city districts, public transportation, and a strong lineup of shopping and dining in the surrounding east Charlotte and inner-city corridors.
"The draw here is convenience, character, and the kind of yard space that is increasingly hard to find."
Eastwood Acres sits in east Charlotte near the Plaza Midwood, NoDa, and Uptown corridors, with Central Ave also mentioned in nearby-location remarks. Some listings note the light rail is about 1 mile away, and multiple homes describe easy access to major interstates and public transportation. Nearby destinations specifically called out include Lang Van, Plaza Midwood, NoDa, Uptown, and the University Area, along with shopping, retail, and restaurants in those corridors. School names are not identified in the provided records, so the neighborhood’s school assignment remains unspecified here. What is clear is the location story: this is a well-situated Charlotte community with a central-east address and fast reach to some of the city’s most recognizable urban districts.
Palmetto Park Realty Team · Charlotte
Ask about Eastwood Acres — we answer fast
See what it's worth — your home's own sale history plus recent Eastwood Acres sales, free.
What's my home worth?Communities similar to Eastwood Acres
 0.8 mi
 Shannon Park, Charlotte
12 active · $367,405
 1.0 mi
 Shamrock Hills, Charlotte
10 active · $321,950
 1.2 mi
 Markham Village, Charlotte
4 active · $305,000
 1.1 mi
 Tiffany Terrace, Charlotte
3 active · $435,000
 1.6 mi
 Shenandoah Park, Charlotte
2 active · $346,500
 1.1 mi
 Briarwood, Charlotte
2 active · $270,000
42 recently sold in Eastwood Acres, Charlotte
| Property | Sold | Sold Price | Days on Market | Size | Sold to Ask | Sold $/SF |
|---|---|---|---|---|---|---|
| | Jul 20 2026 | $360,000 | 59 | 1,624 sq ft | 102.9% | $222 |
| | Apr 10 2026 | $199,900 | 29 | 1,318 sq ft | 100.0% | $152 |
| | Apr 8 2026 | $285,000 | 77 | 934 sq ft | 98.3% | $305 |
| | Jun 16 2025 | $365,000 | 66 | 1,291 sq ft | 100.0% | $283 |
| | May 16 2025 | $265,000 | 77 | 763 sq ft | 100.0% | $347 |
| | Feb 10 2025 | $325,000 | 32 | 1,258 sq ft | 100.0% | $258 |
| | Jan 14 2025 | $304,000 | 92 | 1,100 sq ft | 99.4% | $276 |
| | Oct 1 2024 | $294,500 | 41 | 956 sq ft | 100.0% | $308 |
| | Aug 16 2024 | $268,000 | 76 | 881 sq ft | 97.3% | $304 |
| | May 13 2024 | $240,000 | 38 | 975 sq ft | 96.0% | $246 |
| | Mar 5 2024 | $257,000 | 56 | 850 sq ft | 98.9% | $302 |
| | Nov 17 2023 | $285,000 | 28 | 944 sq ft | 101.8% | $302 |
| | Oct 31 2023 | $270,000 | 188 | 872 sq ft | 103.8% | $310 |
| | Oct 30 2023 | $275,000 | 53 | 883 sq ft | 101.9% | $311 |
| | Oct 23 2023 | $267,700 | 44 | 864 sq ft | 98.5% | $310 |
| | Sep 19 2023 | $280,000 | 67 | 1,198 sq ft | 93.4% | $234 |
| | Jul 17 2023 | $186,700 | 39 | 860 sq ft | 109.9% | $217 |
| | Jun 9 2023 | $235,000 | 50 | 939 sq ft | 97.9% | $250 |
| | Jun 5 2023 | $280,000 | 48 | 904 sq ft | 90.3% | $310 |
| | May 12 2023 | $280,000 | 29 | 864 sq ft | 105.7% | $324 |
| | Feb 7 2023 | $275,000 | 39 | 1,008 sq ft | 98.2% | $273 |
| | Aug 19 2022 | $250,000 | 69 | 747 sq ft | 100.0% | $335 |
| | Aug 1 2022 | $220,000 | 41 | 864 sq ft | 104.8% | $255 |
| | Jul 22 2022 | $185,000 | 20 | 864 sq ft | 80.4% | $214 |
| | Jul 8 2022 | $250,000 | 37 | 958 sq ft | 102.0% | $261 |
| | Jun 28 2022 | $225,000 | 39 | 864 sq ft | 100.0% | $260 |
| | May 12 2022 | $330,100 | 33 | 1,422 sq ft | 100.1% | $232 |
| | Apr 22 2022 | $235,000 | 280 | 876 sq ft | 102.2% | $268 |
| | Apr 4 2022 | $219,000 | 24 | 864 sq ft | 109.5% | $253 |
| | Nov 29 2021 | $268,000 | 38 | 864 sq ft | 107.2% | $310 |
| | Jun 30 2021 | $225,000 | 49 | 960 sq ft | 95.7% | $234 |
| | Jun 25 2021 | $245,000 | 64 | 946 sq ft | 103.5% | $259 |
| | Jun 11 2021 | $187,000 | 29 | 864 sq ft | 98.4% | $216 |
| | Jun 9 2021 | $155,000 | 51 | 864 sq ft | 107.0% | $179 |
| | May 19 2021 | $224,000 | 96 | 874 sq ft | 95.3% | $256 |
| | Dec 10 2020 | $227,000 | 44 | 938 sq ft | 99.2% | $242 |
| | Nov 4 2020 | $117,500 | 19 | 886 sq ft | 98.7% | $133 |
| | Oct 12 2020 | $165,900 | 181 | 864 sq ft | 100.0% | $192 |
| | Oct 6 2020 | $229,950 | 65 | 941 sq ft | 100.0% | $244 |
| | Apr 13 2020 | $238,500 | 55 | 944 sq ft | 97.3% | $253 |
| | Dec 19 2019 | $210,000 | 126 | 1,228 sq ft | 91.7% | $171 |
| | Nov 12 2019 | $107,000 | 11 | 864 sq ft | 125.9% | $124 |
Closed sales from MLS history for Eastwood Acres, Charlotte
Eastwood Acres median sale price is $304,000, up 13.4% from a year ago.
The Eastwood Acres real estate market shows balanced market conditions. Homes typically sell within 48 days. With 1 active listing and 3 homes sold in the past year, a healthy balance exists between buyers and sellers.
Listings taken off the market in the past year in Eastwood Acres, Charlotte
Charlotte, NC 28215
3 bd · 1 ba · 864 sqft
Charlotte, NC 28215
2 bd · 1 ba · 765 sqft
These homes are no longer available, but they show recent pricing and listing activity in Eastwood Acres. Our agents can help you watch for new listings in this area.
Contact an agentFree account needed — create one to continue viewing homes.
Members see everything — free👋 Still browsing Eastwood Acres?
Full photos, price history, and every active & pending home in Eastwood Acres with a free account.
Palmetto Park Realty Team
 $360K
$360KCheck your messages
We sent a code to .
Verify your number and we'll text you price drops and new Eastwood Acres listings. 1–2 texts a month, stop anytime.
Enjoy full access to this home and every home on Palmetto Park.