Buyers have more negotiating power. Properties may take longer to sell. Prices have declined 20%. Homes are frequently selling above list price.

| Property | Sold Date▼ | Sale Price↕ | DOM↕ | LP/SP↕ | Size↕ | $/SF↕ |
|---|---|---|---|---|---|---|
 SOLD 240 Apple Branch Lane 3 bed2 bath | Oct 21 2025 | $275,000 | 151 | 92% | 1902 sq ft | $145 |
 SOLD 227 Apple Branch Lane 3 bed2 bath | Sep 25 2025 | $410,000 | 49 | 🎯101% | 1955 sq ft | $210 |
 SOLD 312 Terrace Hills Drive 3 bed2 bath | Aug 25 2025 | $295,000 | 90 | 🎯100% | 1487 sq ft | $198 |
3 month gap in market activity | ||||||
 SOLD 514 Cider Park Drive 3 bed2 bath | May 15 2025 | $399,900 | 43 | 🎯100% | 1950 sq ft | $205 |
 SOLD 245 Apple Branch Lane 3 bed2 bath | May 9 2025 | $320,000 | 35 | 96% | 1680 sq ft | $190 |
 SOLD 489 Cider Park Drive 3 bed2 bath | Mar 31 2025 | $345,000 | 45 | 🎯100% | 1724 sq ft | $200 |
3 month gap in market activity | ||||||
 SOLD 492 Cider Park Drive 3 bed2 bath | Dec 19 2024 | $329,900 | 92 | 97% | 1715 sq ft | $192 |
 SOLD 252 Apple Branch Lane 3 bed2 bath | Oct 30 2024 | $319,900 | 49 | 🎯100% | 1613 sq ft | $198 |
3 month gap in market activity | ||||||
 SOLD 312 Terrace Hills Drive 3 bed2 bath | Jul 26 2024 | $289,900 | 93 | 97% | 1487 sq ft | $195 |
 SOLD 433 Cider Park Drive 3 bed2 bath | Jul 10 2024 | $375,000 | 76 | 99% | 1959 sq ft | $191 |
8 month gap in market activity | ||||||
 SOLD 515 Cider Park Drive 3 bed3 bath | Nov 2 2023 | $425,000 | 23 | 94% | 2273 sq ft | $187 |
 SOLD 348 Terrace Hills Drive 3 bed2 bath | Sep 27 2023 | $375,100 | 30 | 🎯103% | 1578 sq ft | $238 |
5 month gap in market activity | ||||||
 SOLD 518 Cider Park Drive 3 bed2 bath | Apr 14 2023 | $480,000 | 35 | 🎯112% | 3362 sq ft | $143 |
 SOLD 313 Terrace Hills Drive 3 bed2 bath | Mar 3 2023 | $298,900 | 45 | 🎯100% | 1555 sq ft | $192 |
5 month gap in market activity | ||||||
 SOLD 348 Terrace Hills Drive 3 bed2 bath | Sep 9 2022 | $300,000 | 39 | 97% | 1578 sq ft | $190 |
2 month gap in market activity | ||||||
 SOLD 498 Cider Park 4 bed3 bath | Jun 24 2022 | $350,000 | 56 | 🎯100% | 2237 sq ft | $156 |
7 month gap in market activity | ||||||
 SOLD 216 Apple Branch Lane 3 bed2 bath | Nov 4 2021 | $290,000 | 44 | 🎯102% | 1868 sq ft | $155 |
2 month gap in market activity | ||||||
 SOLD 839 E Golden View Lane 3 bed2 bath | Aug 23 2021 | $350,000 | 46 | 97% | 2258 sq ft | $155 |
 SOLD 838 E Golden View Lane 4 bed3 bath | Jul 9 2021 | $276,000 | 30 | 🎯100% | 2322 sq ft | $119 |
 SOLD 507 Cider Park Dr 4 bed2 bath | Jun 21 2021 | $294,900 | 53 | 🎯104% | 2000 sq ft | $147 |
4 month gap in market activity | ||||||
 SOLD 330 Terrace Hills Dr 3 bed3 bath | Feb 11 2021 | $262,000 | 93 | 97% | 2368 sq ft | $111 |
4 month gap in market activity | ||||||
 SOLD 498 Cider Park Drive 3 bed3 bath | Sep 30 2020 | $280,000 | 105 | 🎯100% | 2251 sq ft | $124 |
5 month gap in market activity | ||||||
 SOLD 429 Cider Park Dr 4 bed2 bath | Apr 30 2020 | $280,000 | 85 | 97% | 2579 sq ft | $109 |
4 month gap in market activity | ||||||
 SOLD 518 Cider Park Drive 3 bed2 bath | Dec 23 2019 | $300,000 | 95 | 92% | 3048 sq ft | $98 |
2 month gap in market activity | ||||||
 SOLD 821 E Golden View Lane 3 bed2 bath | Oct 4 2019 | $275,000 | 141 | 97% | 2121 sq ft | $130 |
 SOLD 477 Cider Park Dr 3 bed2 bath | Sep 3 2019 | $280,000 | 46 | 98% | 2233 sq ft | $125 |
 SOLD 252 Apple Branch Lane 3 bed2 bath | Aug 22 2019 | $207,000 | 71 | 99% | 1613 sq ft | $128 |
 SOLD 489 Cider Park Drive 3 bed2 bath | Jun 28 2019 | $206,000 | 43 | 99% | 1724 sq ft | $119 |
 SOLD 507 Cider Park Drive 4 bed2 bath | May 7 2019 | $246,000 | 301 | 95% | 1940 sq ft | $127 |
 SOLD 440 Cider Park Drive 4 bed3 bath | Mar 11 2019 | $270,000 | 40 | 96% | 2800 sq ft | $96 |
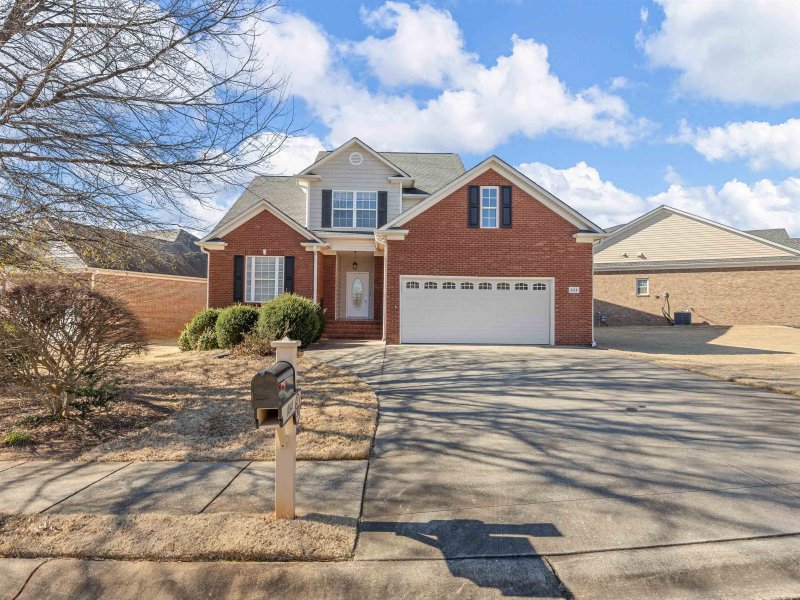
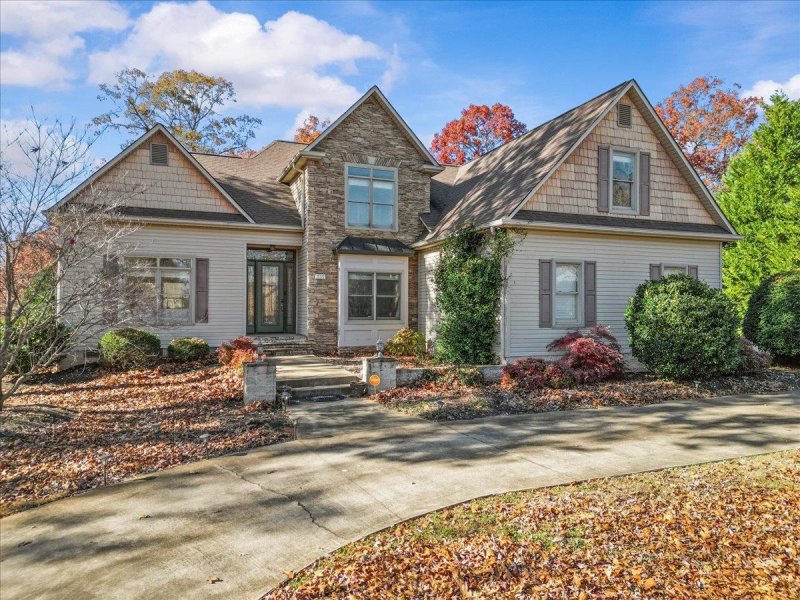
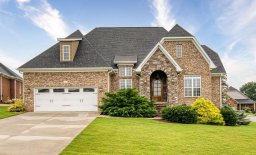
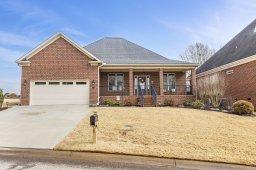
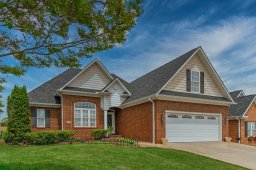
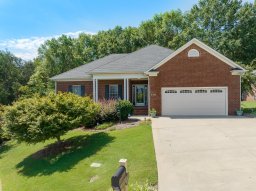
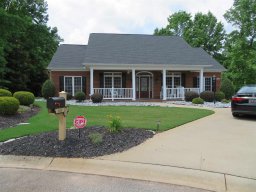
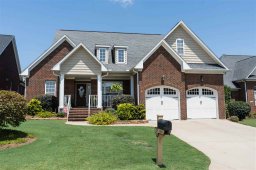
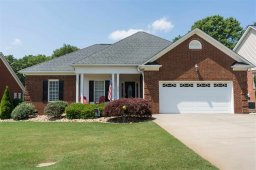
240 Apple Branch Lane
$275,000
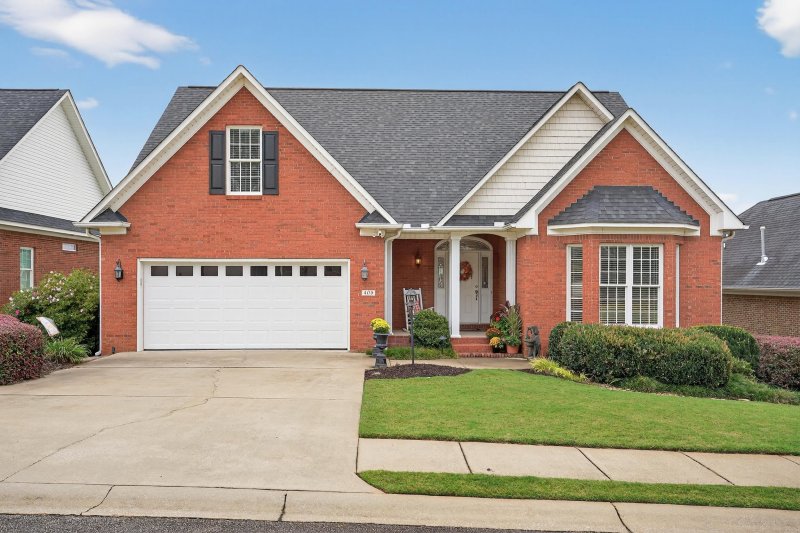
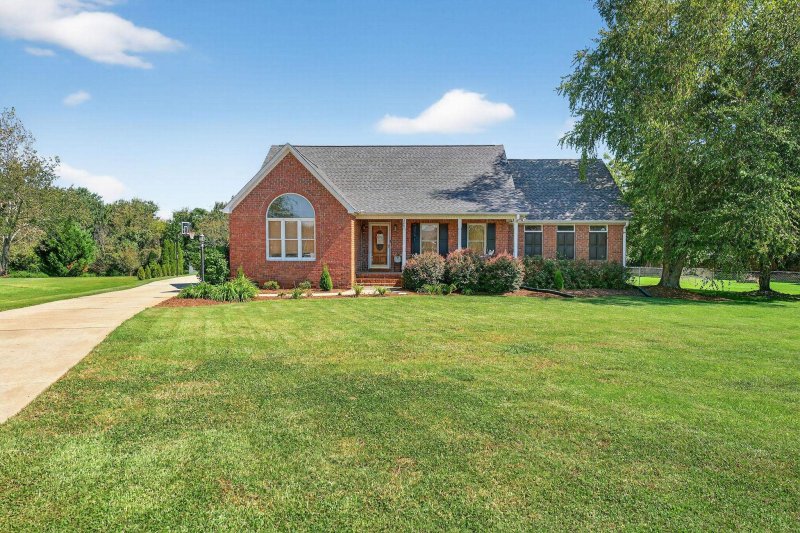
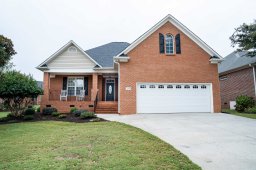
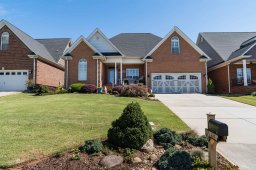
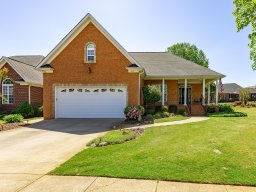
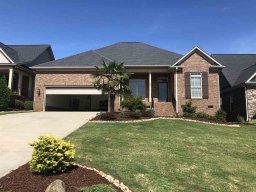
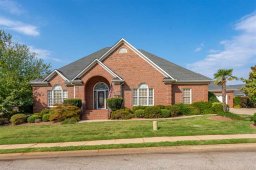
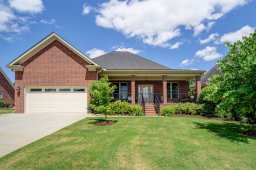
227 Apple Branch Lane
$410,000
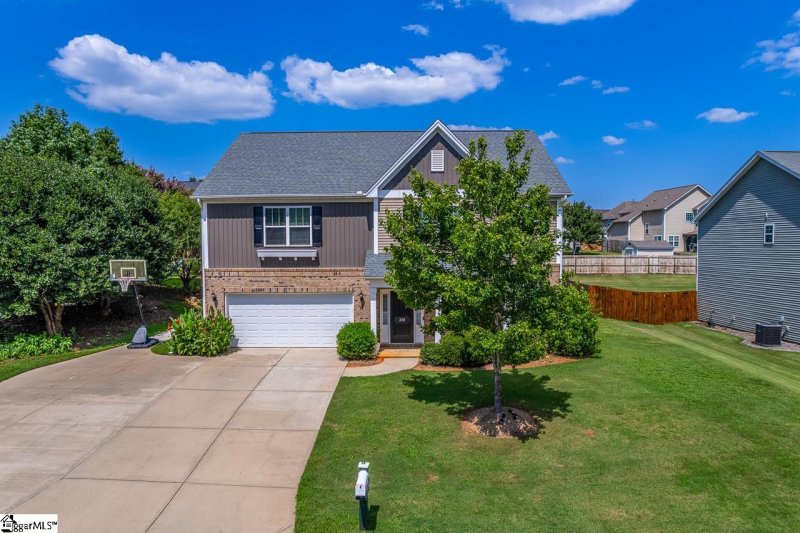
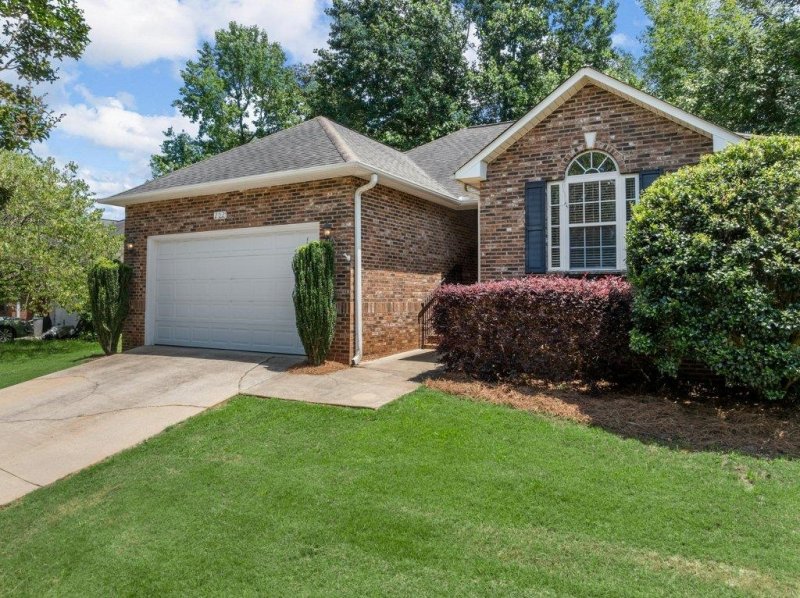
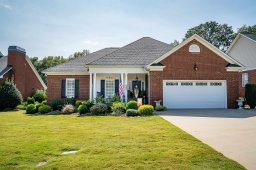
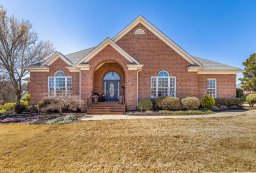
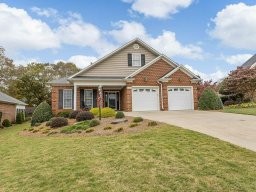
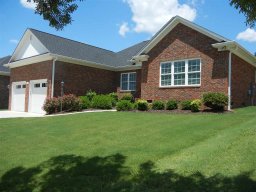
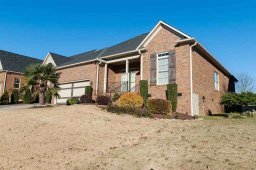
312 Terrace Hills Drive
$295,000
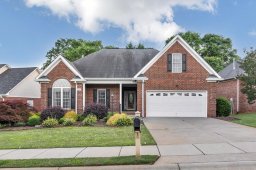
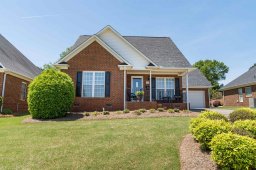
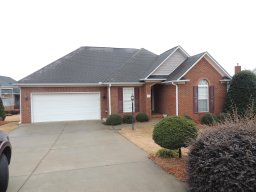
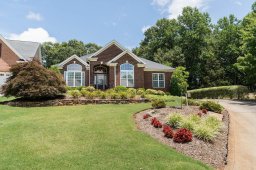
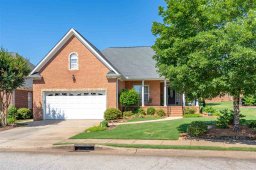
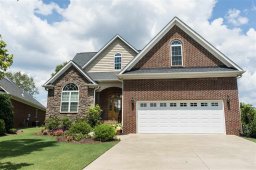
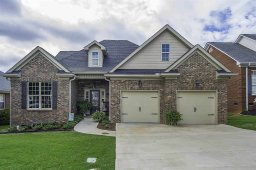
514 Cider Park Drive
$399,900
245 Apple Branch Lane
$320,000
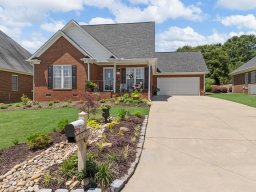
489 Cider Park Drive
$345,000
492 Cider Park Drive
$329,900
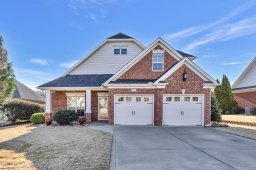
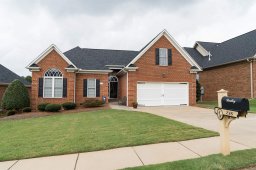
252 Apple Branch Lane
$319,900
312 Terrace Hills Drive
$289,900
433 Cider Park Drive
$375,000
515 Cider Park Drive
$425,000
348 Terrace Hills Drive
$375,100
518 Cider Park Drive
$480,000
313 Terrace Hills Drive
$298,900
348 Terrace Hills Drive
$300,000
498 Cider Park
$350,000
216 Apple Branch Lane
$290,000
839 E Golden View Lane
$350,000
838 E Golden View Lane
$276,000
507 Cider Park Dr
$294,900
330 Terrace Hills Dr
$262,000
498 Cider Park Drive
$280,000
429 Cider Park Dr
$280,000
518 Cider Park Drive
$300,000
821 E Golden View Lane
$275,000
477 Cider Park Dr
$280,000
252 Apple Branch Lane
$207,000
489 Cider Park Drive
$206,000
507 Cider Park Drive
$246,000
440 Cider Park Drive
$270,000
The Sugar Ridge Com real estate market shows buyer's market conditions. Homes typically sell within 3542 days. With 2 active listings and 6 homes sold in the past year, Buyers have more negotiating power and time to decide.
Median Price:$384,949.5
Average Price:$384,949.5
Avg Bedrooms:3.3
Avg Bathrooms:2.2
Avg Lot Size:0.20 acres
Active Listings:2
Sold Last Year:6
Median Days to Sell:3542 days
Has HOA:No
Median Year Built:2006
New Construction:0%