Sold
$274,900 $262/sqft
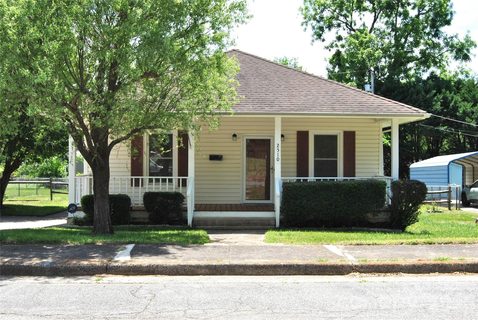
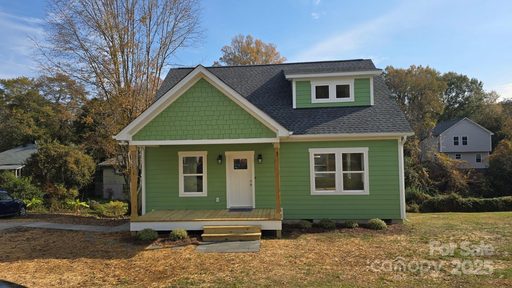
2510 Boundary Street
Belmont, NC 28012
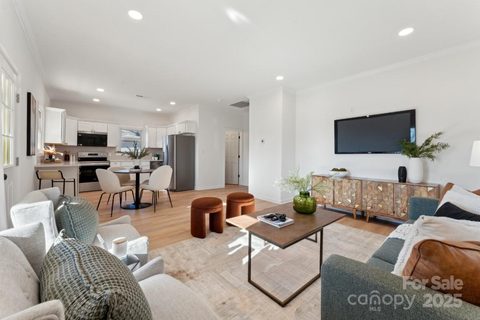
2 bd · 1 ba · 1,050 sqft · 1900 · DOM: 72 d
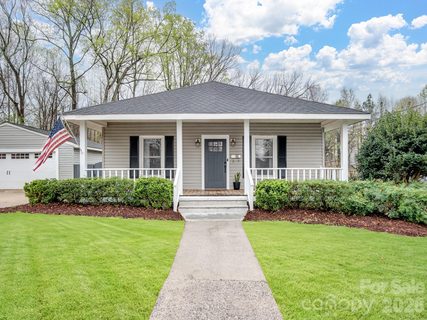
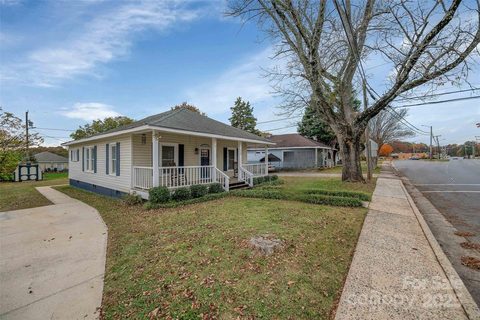
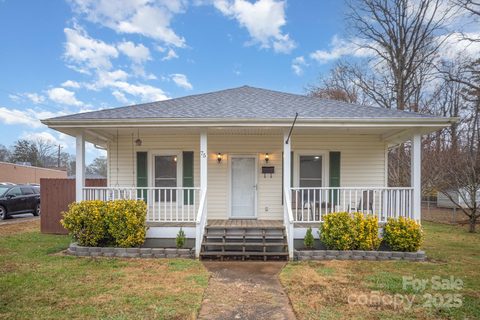
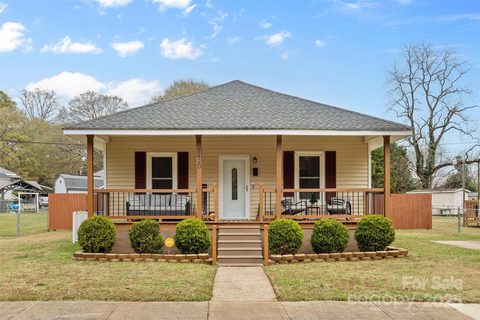
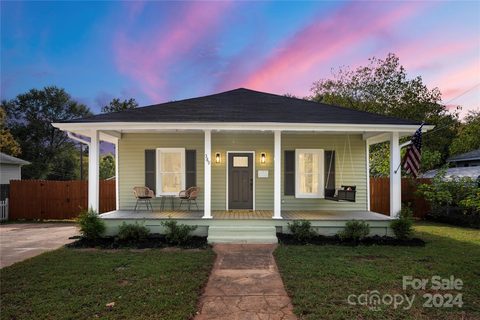
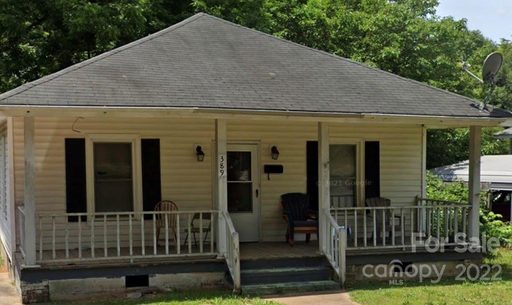
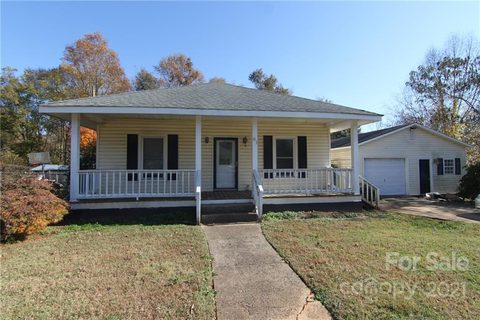
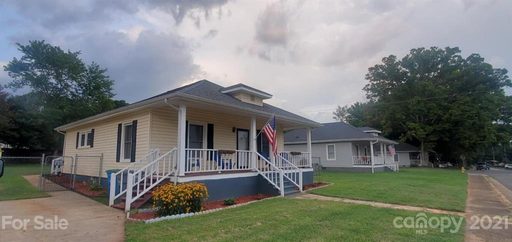
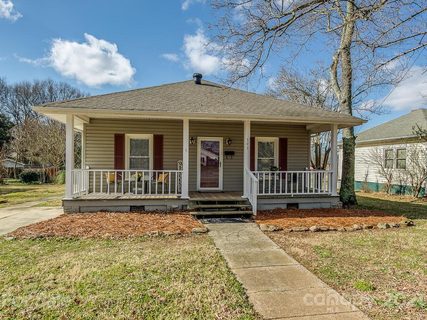
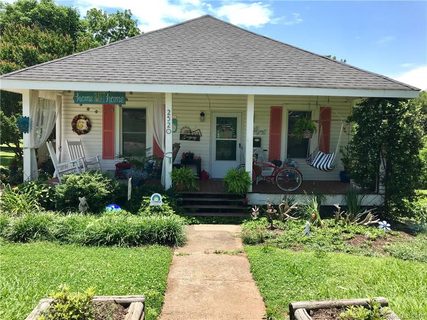
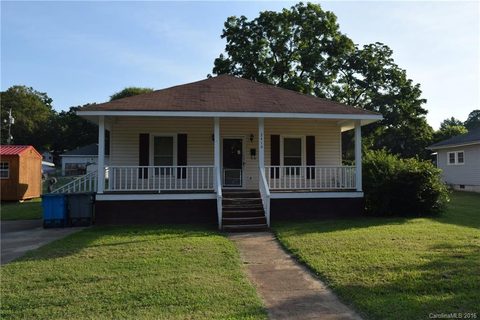
Goshen Woods has the feel of an older Belmont pocket where front porches, level lots, and everyday practicality still shape the streetscape.
Community overview based on MLS listing data for Goshen Woods, Belmont
Goshen Woods has the feel of an older Belmont pocket where front porches, level lots, and everyday practicality still shape the streetscape. The homes are modest in scale but full of character, with many residences updated over time rather than replaced outright. That gives the neighborhood a lived-in, approachable quality that fits especially well with Belmont’s historic core and its easy connection to the city’s main corridors.
"Front-porch charm and close-in convenience define the rhythm of this Belmont neighborhood."
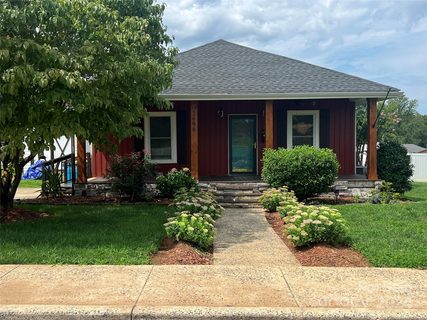
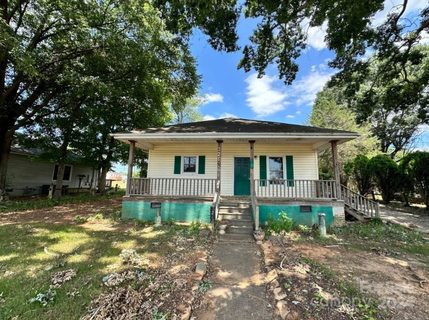
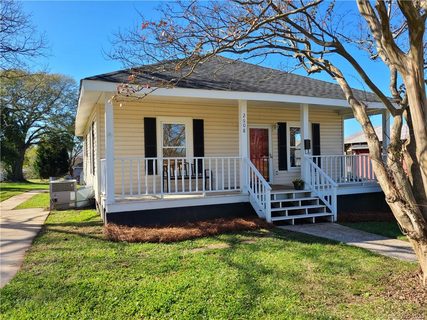
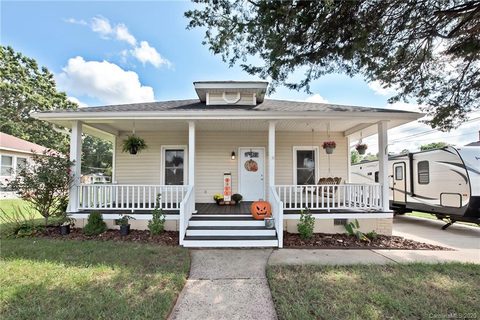
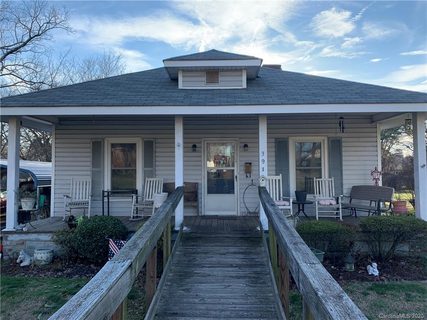
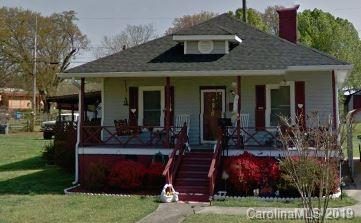
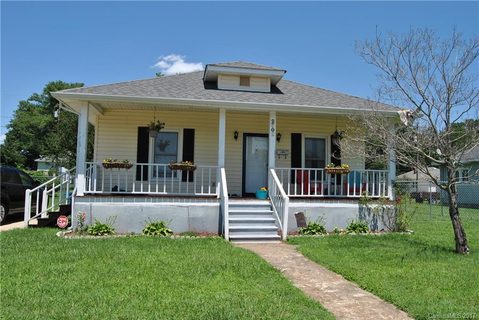
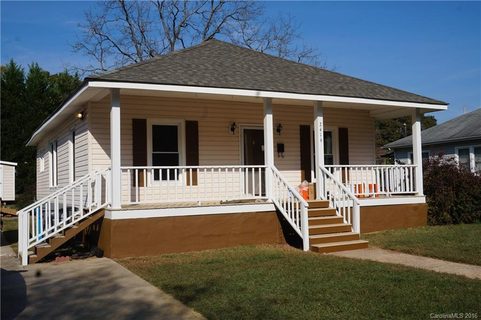
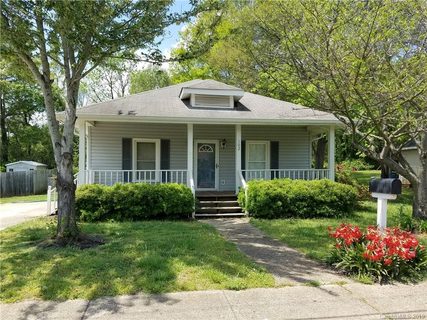
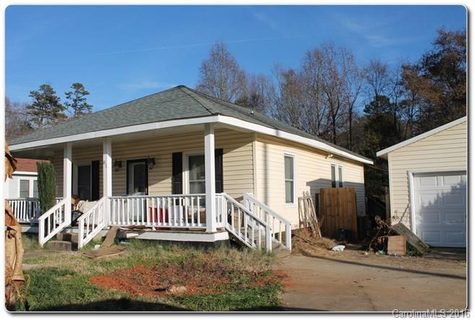
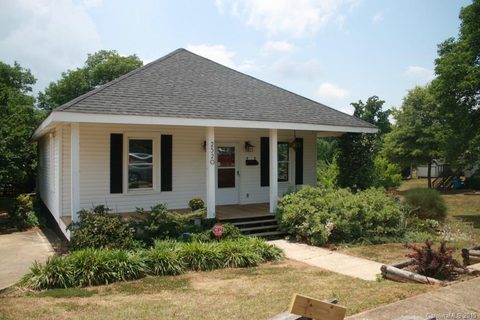
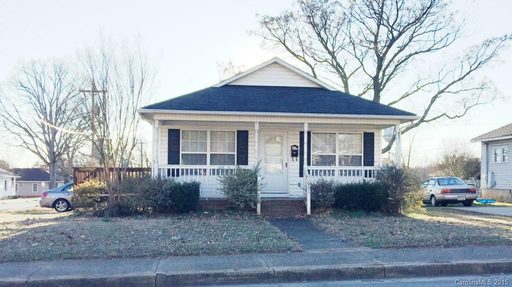
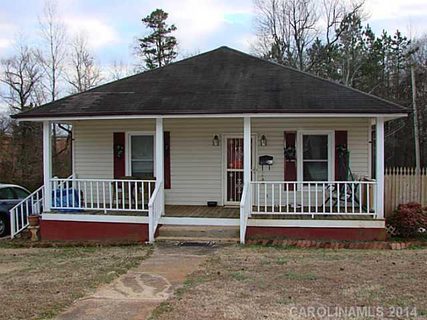
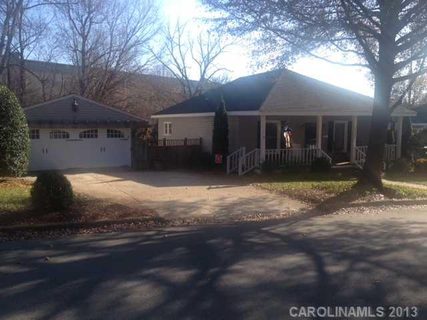
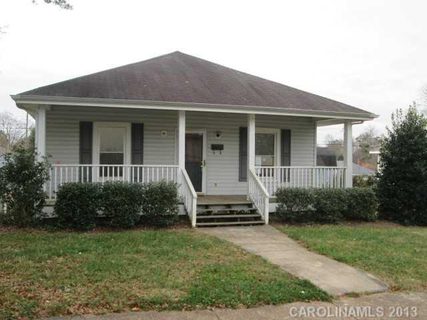
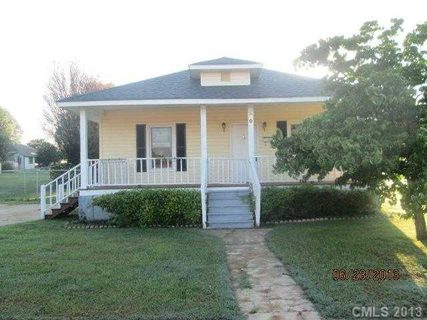
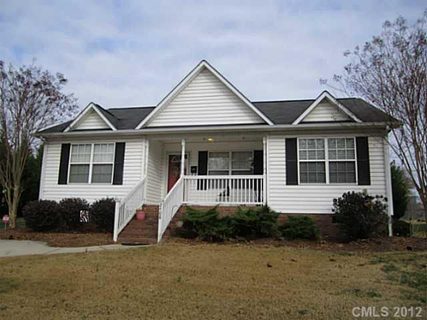
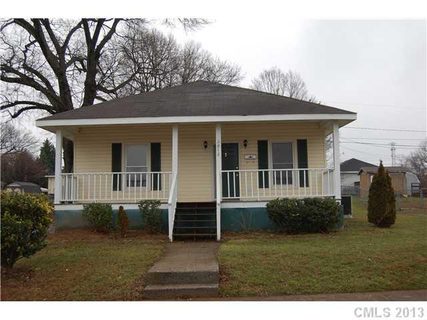
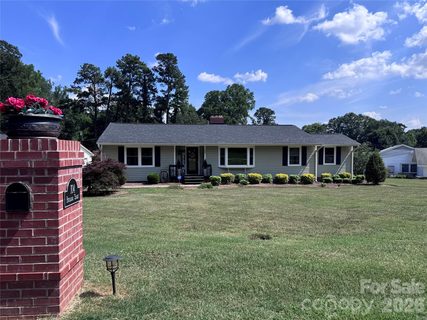
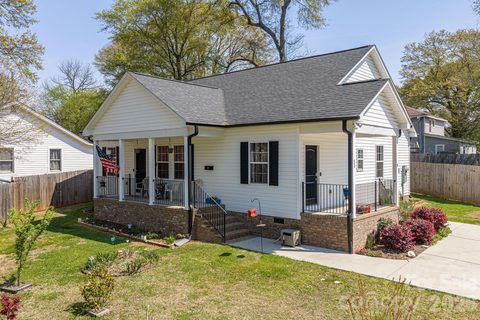
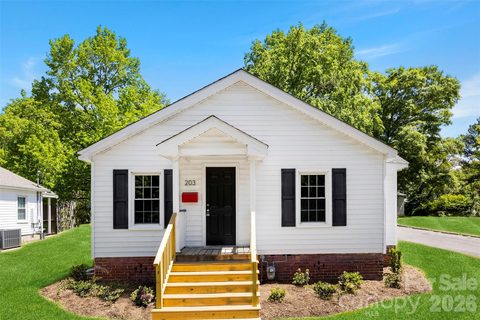
Most homes here are single-family residences, and the architectural story leans toward cottages, bungalows, and ranch-style homes with one-level living. Several listings highlight covered porches, decks, fenced yards, and storage buildings, while others add newer roofs, refreshed kitchens, and updated flooring. Brick is not a dominant visual theme, so the better fit is a mix of traditional exterior finishes rather than a brick-forward streetscape.
Lot sizes are comfortable for the area, averaging just over a quarter acre, which helps the neighborhood feel open without losing its residential scale. The strongest impression is one of practical charm: homes that have been improved for daily use, with enough outdoor space for gardening, entertaining, or simply enjoying a front porch at the end of the day.
Daily life in Goshen Woods is shaped less by formal amenities and more by what is close at hand. Sidewalk access appears in some remarks, and the neighborhood’s setting makes it easy to move between home, downtown errands, and nearby local gathering spots. Belmont’s dining and shopping options are close by, and several listings call out quick access to Belmont Abbey College, Charlotte Douglas International Airport, and the broader I-85 corridor. That keeps the community connected without feeling overly busy.
"This is a neighborhood where porch living, short drives, and in-town convenience come together naturally."
Goshen Woods sits in Belmont near downtown Belmont and the city’s historic Main Street area, with Jackson Street, Woodlawn Street, Belmont Avenue, and Boundary Street all appearing in nearby listings. Commuting is straightforward: I-85 is mentioned repeatedly as a quick access point, I-74 appears in one listing, and Charlotte Douglas International Airport is described as about 15 minutes away in one remark and under 20 minutes in another. Downtown Belmont is typically described as a short drive or just minutes away, while downtown Mt. Holly and Charlotte center-city are also referenced as nearby destinations.
School references consistently point to North Belmont Elementary and Belmont Middle, with Belmont Abbey College serving as a notable nearby landmark. The high school is not specified in the source material, so it remains unspecified here. Overall, the location balances small-town Belmont convenience with fast regional reach.
Palmetto Park Realty Team · Belmont
Ask about Goshen Woods — we answer fast
See what it's worth — your home's own sale history plus recent Goshen Woods sales, free.
What's my home worth?Communities similar to Goshen Woods
 0.7 mi
 Pebble Creek, Belmont
3 active · $275,000
 0.9 mi
 Hall Park, Belmont
2 active · $412,450
 2.0 mi
 Adrian Park, Mount Holly
3 active · $215,000
 1.6 mi
 Lincoln Park, Belmont
3 active · $220,000
 2.7 mi
 Riverside Drive, Belmont
3 active · $165,000
 8.3 mi
 Firestone Textiles Inc, Gastonia
6 active · $252,500
Closed sales from MLS history for Goshen Woods, Belmont
Goshen Woods median sale price is $265,000; Belmont is up 3.9%.
Below trend-line threshold — city median shown for context
The Goshen Woods real estate market shows balanced market conditions. Homes typically sell within 52 days. With 0 active listings and 5 homes sold in the past year, a healthy balance exists between buyers and sellers.
Listings taken off the market in the past year in Goshen Woods, Belmont
These homes are no longer available, but they show recent pricing and listing activity in Goshen Woods. Our agents can help you watch for new listings in this area.
Contact an agent