Belmont Homes for Sale
1 home


Market Trends
Fair conditions for both buyers and sellers. Room for negotiation. Prices have increased 221%.
Year-over-Year Comparison
Last 12 months

Recently Sold Properties
| Property | Sold Date▼ | Sale Price↕ | DOM↕ | LP/SP↕ | Size↕ | $/SF↕ |
|---|---|---|---|---|---|---|
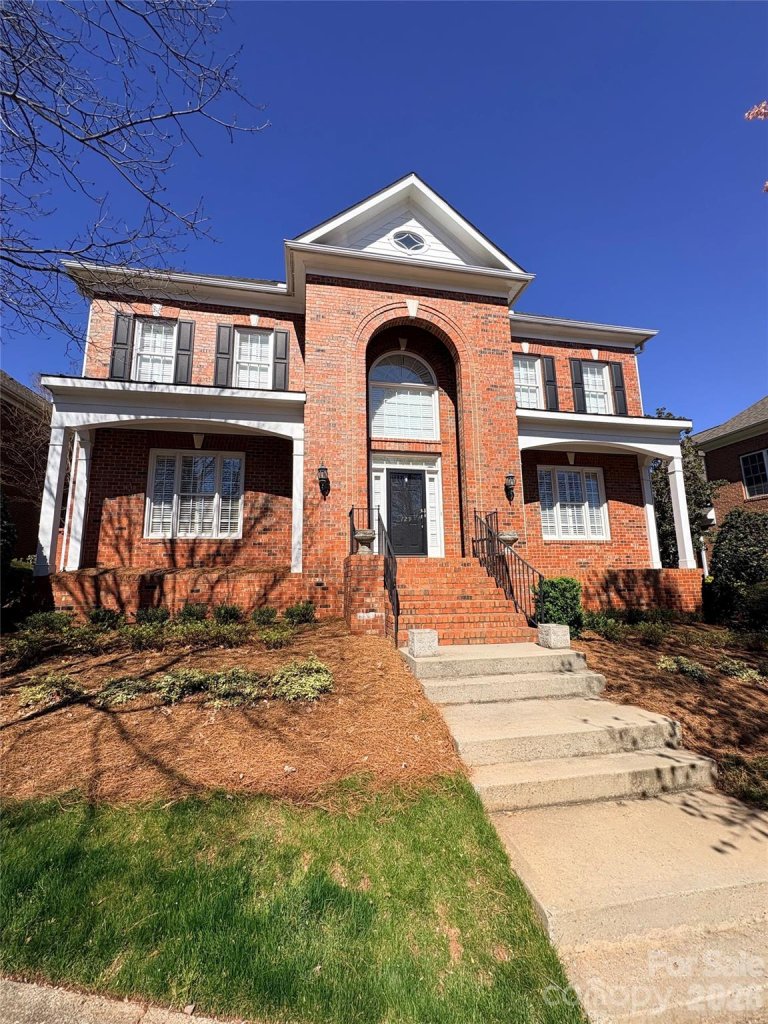
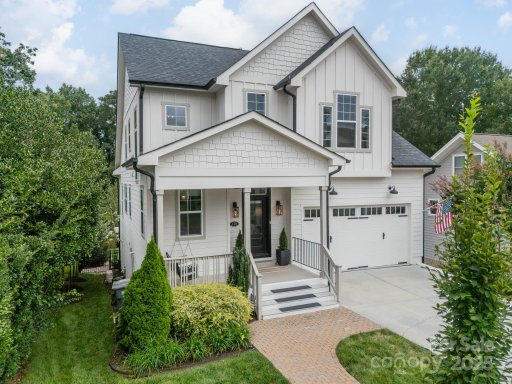 SOLD 115 Bryant Street 4 bed3 bath | Feb 17 2026 | $1.07M | 174 | 🎯100% | 3446 sq ft | $312 |
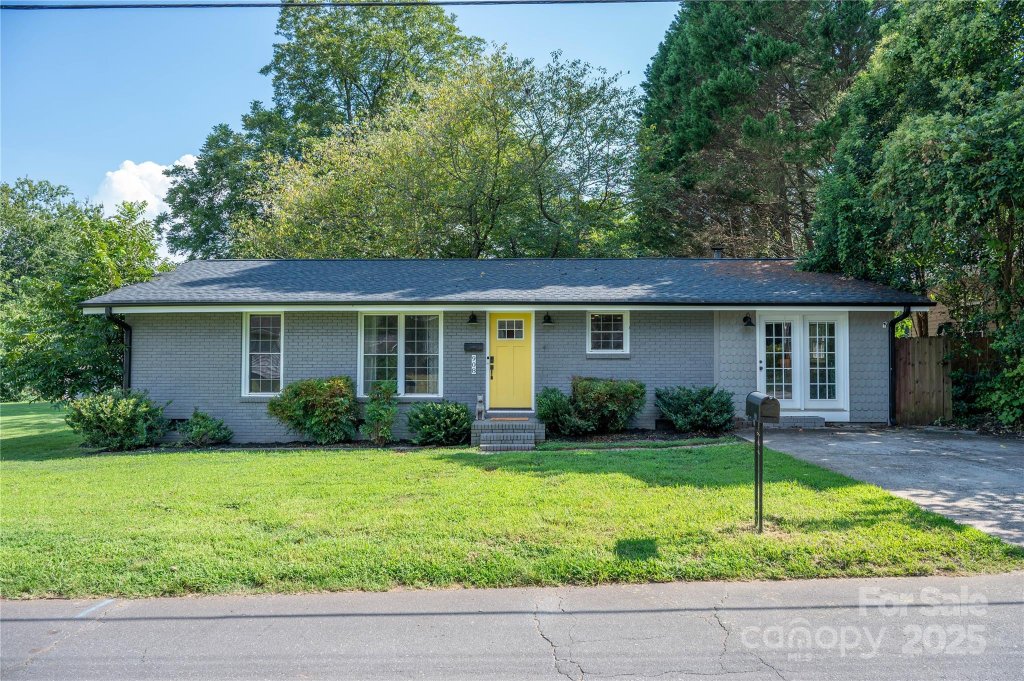
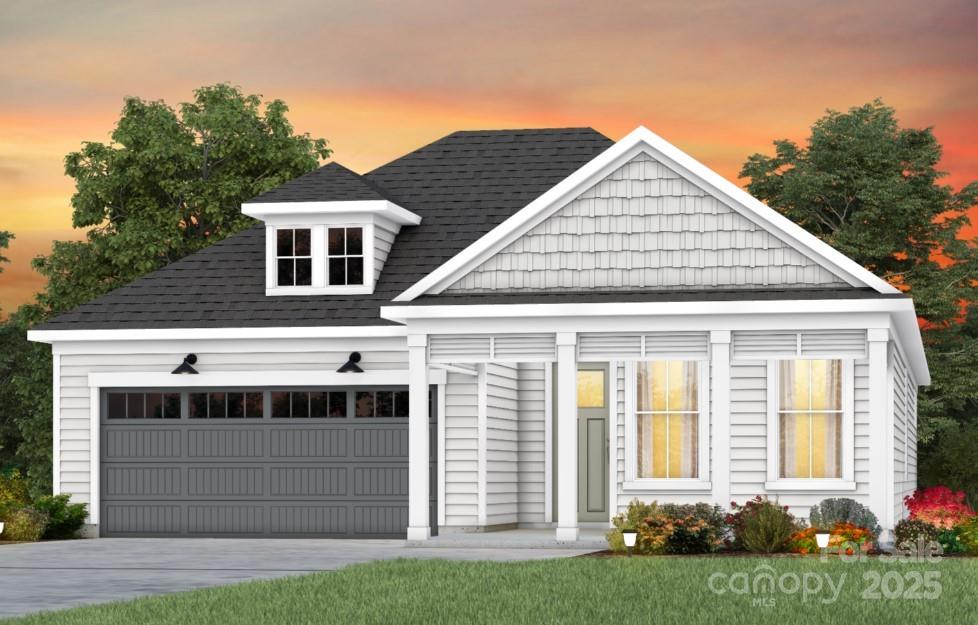
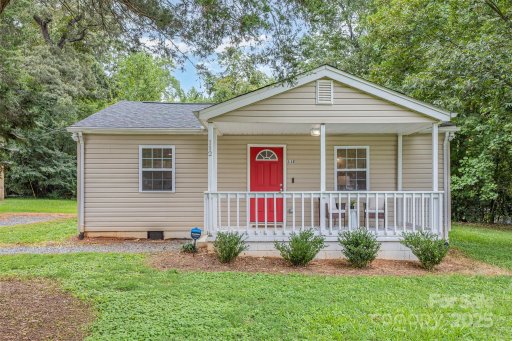
 SOLD 302 Planetree Drive 3 bed1 bath | Jan 5 2026 | $317,500 | 181 | 93% | 1304 sq ft | $243 |
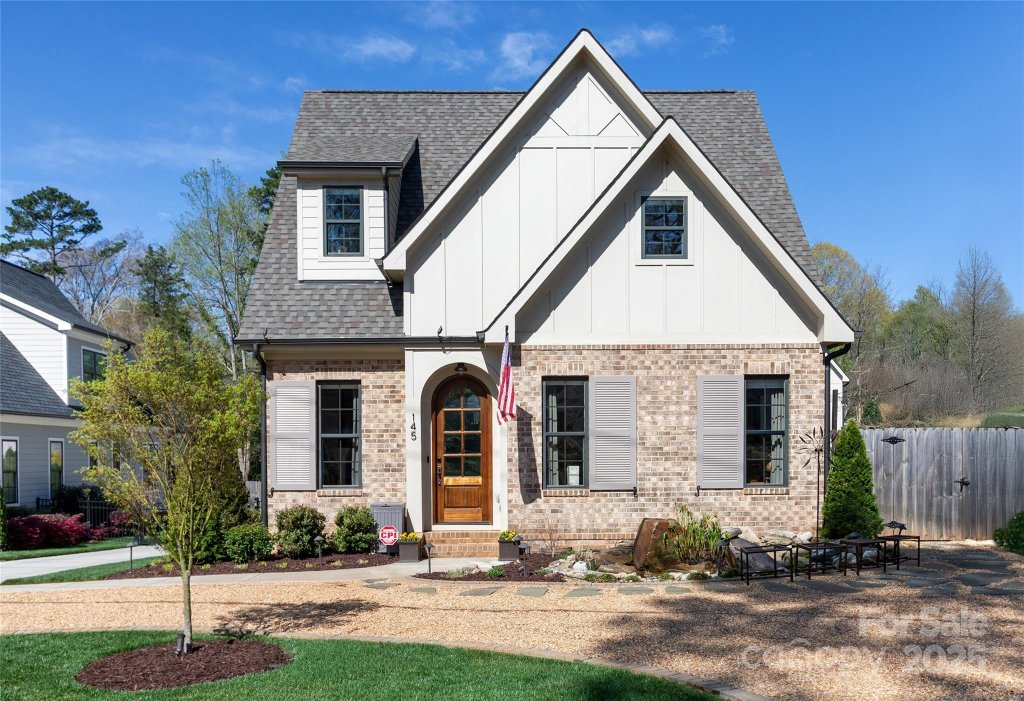
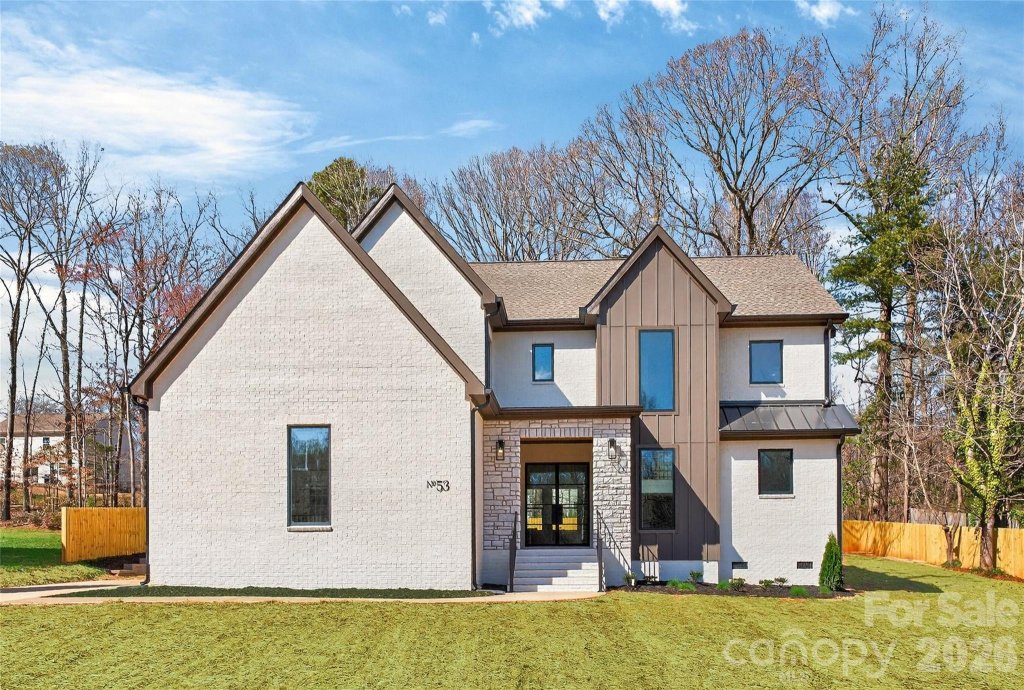
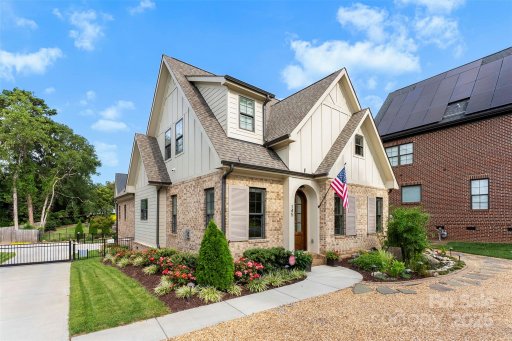 SOLD 145 Willerine Drive 3 bed2 bath | Nov 14 2025 | $815,000 | 77 | 98% | 2318 sq ft | $352 |
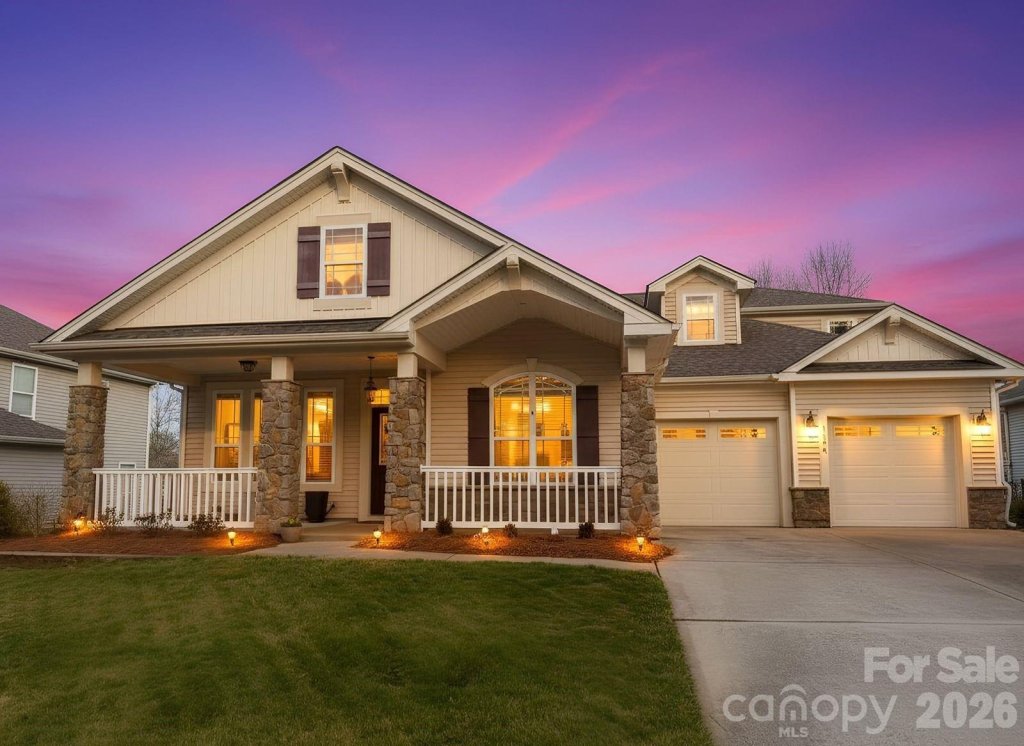
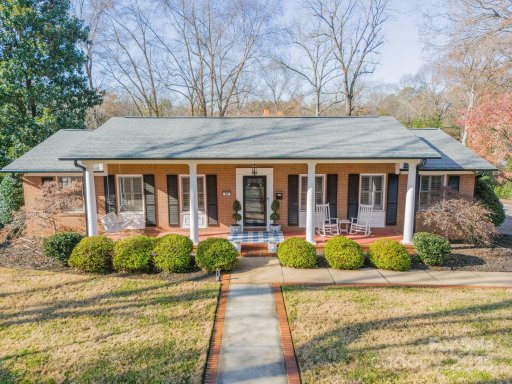
 SOLD 112 Georgia Belle Avenue 2 bed2 bath | Oct 9 2025 | $255,000 | 41 | 🎯102% | 985 sq ft | $259 |
 SOLD 908 Laye Street 3 bed1 bath | Sep 29 2025 | $335,000 | 35 | 🎯100% | 1343 sq ft | $249 |
5 month gap in market activity | ||||||
 SOLD 145 Willerine Drive 3 bed2 bath | Apr 28 2025 | $784,000 | 31 | 🎯100% | 2517 sq ft | $311 |
 SOLD 107 Westwood Drive 4 bed3 bath | Apr 17 2025 | $755,000 | 106 | 92% | 3166 sq ft | $238 |
2 month gap in market activity | ||||||
 SOLD 813 Gaston Avenue 3 bed2 bath | Feb 7 2025 | $350,000 | 74 | 97% | 1869 sq ft | $187 |
2 month gap in market activity | ||||||
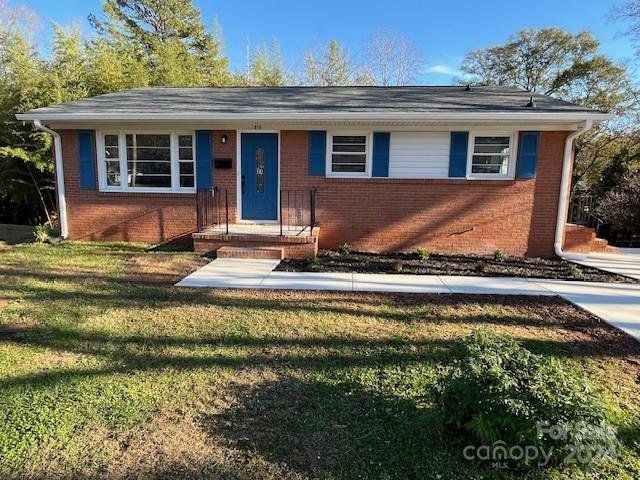
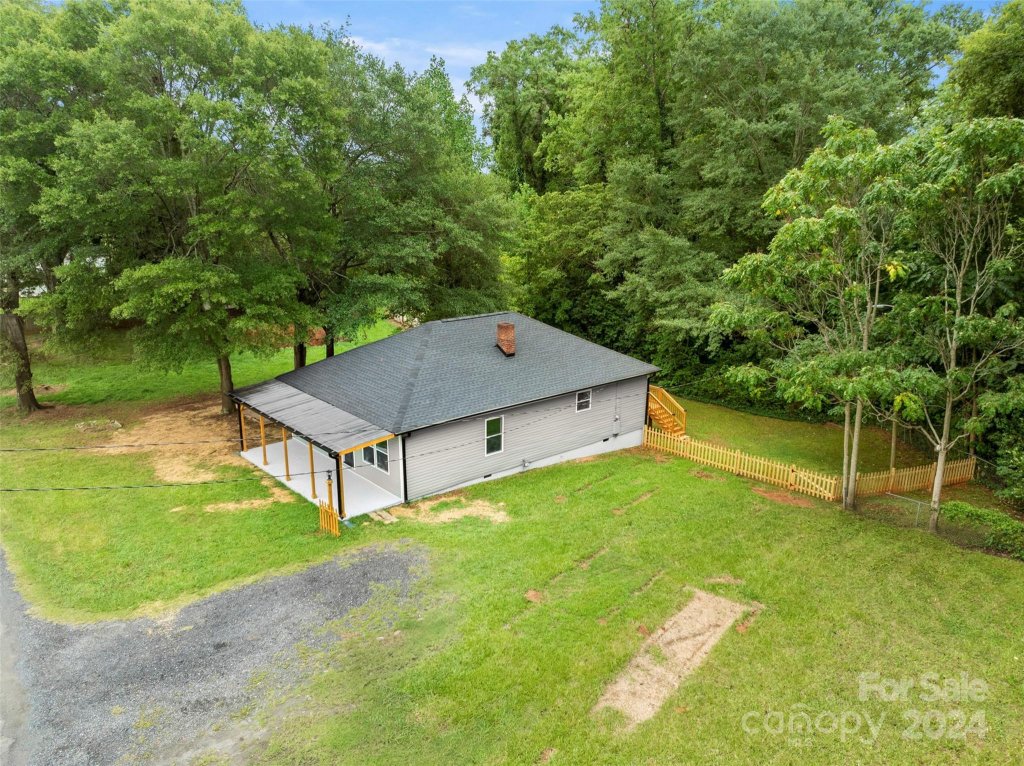
 SOLD 411 Lincoln Street 3 bed2 bath | Nov 25 2024 | $214,000 | 178 | 🎯102% | 1330 sq ft | $161 |
 SOLD 807 Gaston Avenue 4 bed2 bath | Oct 25 2024 | $370,000 | 245 | 99% | 2240 sq ft | $165 |
 SOLD 2011 River View Avenue 3 bed1 bath | Sep 12 2024 | $305,000 | 35 | 95% | 1313 sq ft | $232 |
3 month gap in market activity | ||||||
 SOLD 510 Henry Street 3 bed2 bath | Jun 4 2024 | $155,000 | 42 | 86% | 1356 sq ft | $114 |
1+ year gap in market activity | ||||||
 SOLD 1060 Belmont Village Drive 4 bed3 bath | Oct 10 2022 | $465,000 | 97 | 97% | 2000 sq ft | $233 |
2 month gap in market activity | ||||||
 SOLD 103 Margie Street 3 bed2 bath | Aug 5 2022 | $339,000 | 43 | 97% | 1402 sq ft | $242 |
7 month gap in market activity | ||||||
 SOLD 821 Mark Street 3 bed2 bath | Dec 30 2021 | $353,000 | 41 | 🎯107% | 2042 sq ft | $173 |
 SOLD 220 Planetree Drive 3 bed2 bath | Dec 14 2021 | $380,000 | 25 | 🎯100% | 1704 sq ft | $223 |
7 month gap in market activity | ||||||
 SOLD 412 Church Street 4 bed2 bath | Apr 19 2021 | $280,000 | 19 | 🎯100% | 2204 sq ft | $127 |
10 month gap in market activity | ||||||
 SOLD 512 Secrest Avenue 3 bed2 bath | Jun 22 2020 | $225,000 | 24 | 🎯102% | 1044 sq ft | $216 |
 SOLD 214 Spring Street | Jun 16 2020 | $25,000 | 20 | 🎯100% | — | — |
7 month gap in market activity | ||||||
 SOLD 115 Crestview Drive 3 bed2 bath | Oct 28 2019 | $250,000 | 51 | 91% | 1478 sq ft | $169 |
 SOLD 211 Cedar Street 4 bed2 bath | Oct 15 2019 | $315,000 | 56 | 97% | 2209 sq ft | $143 |
 SOLD 107 Burns Mitchell Drive 5 bed3 bath | Sep 30 2019 | $238,000 | 140 | 99% | 2744 sq ft | $87 |
11 month gap in market activity | ||||||
 SOLD 809 Catawba Street 2 bed1 bath | Oct 22 2018 | $135,000 | 77 | 91% | 875 sq ft | $154 |
12 month gap in market activity | ||||||
 SOLD 518 S Main Street 11 3 bed3 bath | Oct 27 2017 | $410,000 | 64 | 🎯103% | 2526 sq ft | $162 |
2 month gap in market activity | ||||||
 SOLD 220 Planetree Drive 3 bed2 bath | Aug 25 2017 | $244,000 | 87 | 98% | 1704 sq ft | $143 |
10 month gap in market activity | ||||||
 SOLD 304 S Central Avenue 4 bed3 bath | Sep 30 2016 | $710,000 | 137 | 89% | 3310 sq ft | $215 |
1+ year gap in market activity | ||||||
 SOLD 210 13th Street 2 bed1 bath | Sep 18 2015 | $93,000 | 53 | 🎯103% | 879 sq ft | $106 |
4 month gap in market activity | ||||||
 SOLD 202 W Woodrow Avenue 3 bed2 bath | May 7 2015 | $215,000 | 42 | 🎯100% | 1567 sq ft | $137 |
 SOLD 113 Poplar Street 3 bed1 bath | Apr 10 2015 | $153,000 | 69 | 🎯104% | 1287 sq ft | $119 |
2+ year gap in market activity | ||||||
 SOLD 503 W Henry Street 3 bed2 bath | Dec 3 2012 | $93,000 | 67 | 98% | 1332 sq ft | $70 |
115 Bryant Street
$1,075,000
302 Planetree Drive
$317,500
145 Willerine Drive
$815,000
112 Georgia Belle Avenue
$255,000
908 Laye Street
$335,000
145 Willerine Drive
$784,000
107 Westwood Drive
$755,000
813 Gaston Avenue
$350,000
411 Lincoln Street
$214,000
807 Gaston Avenue
$370,000
2011 River View Avenue
$305,000
510 Henry Street
$155,000
1060 Belmont Village Drive
$465,000
103 Margie Street
$339,000
821 Mark Street
$353,000
220 Planetree Drive
$380,000
412 Church Street
$280,000
512 Secrest Avenue
$225,000
214 Spring Street
$25,000
115 Crestview Drive
$250,000
211 Cedar Street
$315,000
107 Burns Mitchell Drive
$238,000
809 Catawba Street
$135,000
518 S Main Street 11
$410,000
220 Planetree Drive
$244,000
304 S Central Avenue
$710,000
210 13th Street
$93,000
202 W Woodrow Avenue
$215,000
113 Poplar Street
$153,000
503 W Henry Street
$93,000
Market Statistics
The Belmont real estate market shows balanced market conditions. Homes typically sell within 56 days. With 1 active listings and 7 homes sold in the past year, A healthy balance between buyers and sellers.
Pricing
Median Price:$1,372,000
Average Price:$1,372,000
Property Details
Avg Bedrooms:3.2
Avg Bathrooms:2.0
Avg Lot Size:0.48 acres
Market Activity
Active Listings:1
Sold Last Year:7
Median Days to Sell:56 days
Community Info
Has HOA:No
Median Year Built:1948
New Construction:0%