Pending
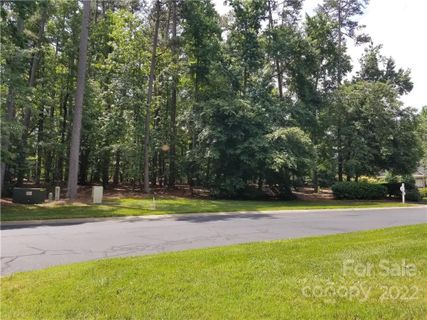
Homesite
$34,000
171 Yadkin Falls None
Badin Lake, NC 28127
2 yr ago
Water
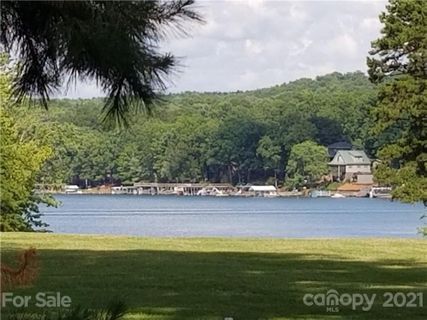
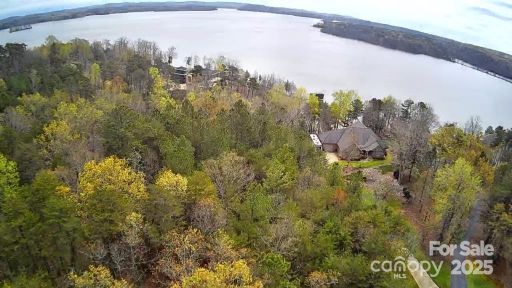
Uwharrie Point is one of Badin Lake's most defined destination communities, combining lake frontage, a private marina, and the Old North State Club's golf course inside a gated setting on the Uwharrie Peninsula.
Community overview based on MLS listing data for Uwharrie Point, Badin Lake
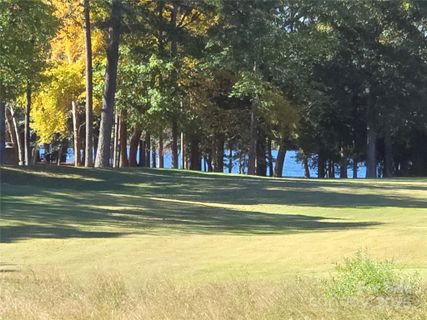
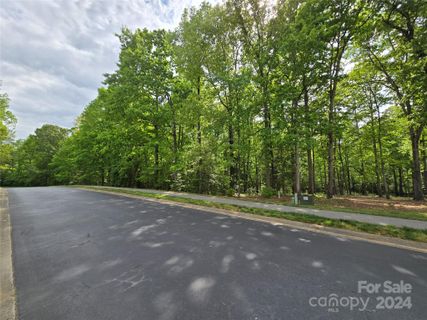
Uwharrie Point is one of Badin Lake's most defined destination communities, combining lake frontage, a private marina, and the Old North State Club's golf course inside a gated setting on the Uwharrie Peninsula. The market here leans heavily toward homesites, so the neighborhood presents itself first as a place to build around the lake-and-fairway landscape, with a smaller collection of custom waterfront homes already in place.
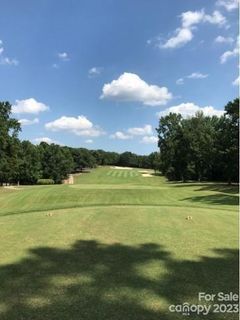
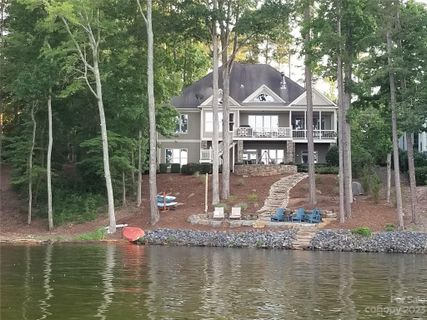
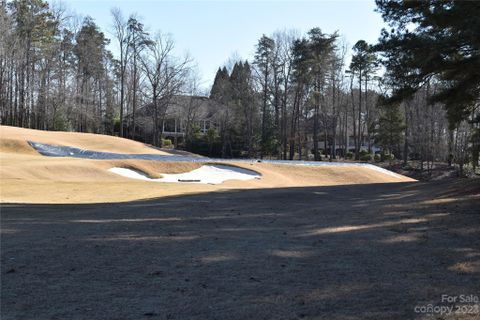
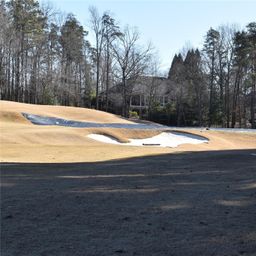
The strongest through-line in Uwharrie Point is the pairing of golf and water. Listings repeatedly center on frontage along fairways, tee boxes, and greens, while many also call out Badin Lake views, main-channel outlooks, or direct waterfront placement. Recent offerings range from modestly priced golf-course lots to estate-scale parcels above 1.5 acres, with active listings between $19,500 and $249,000 and closed sales reaching $1.625 million for an existing waterfront residence.
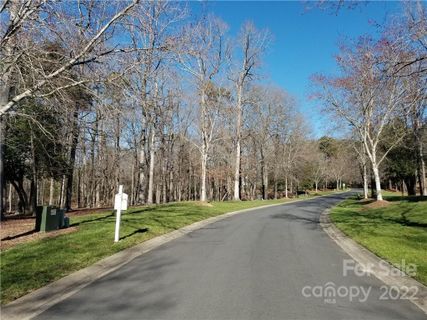
Lot size is a major part of the appeal. Positive recorded lot sizes run from about 7,405 square feet to 81,457 square feet, with a typical tract around 40,075 square feet, or just under an acre. Southpoint stands out for larger homesites and elevated pricing, while Porters Glen, Swift Island, Yadkin Falls, Pattersons Bridge, Millingport, and Allenton Ferry appear as distinct pockets within the gates. Underground power, internet, and county water and sewer are recurring practical advantages that show up alongside the view-driven marketing.
Old North State Club anchors the amenity package. Across listing remarks, the community is consistently described with an 18-hole Tom Fazio-designed golf course, marina access, clubhouse dining, pool access, tennis courts, and 24-hour security. Several properties emphasize proximity to the marina or walkable access to club amenities, and one recent lake-view lot included a one-year boat-slip rental, underscoring how boating is part of the neighborhood's daily rhythm rather than a secondary feature.
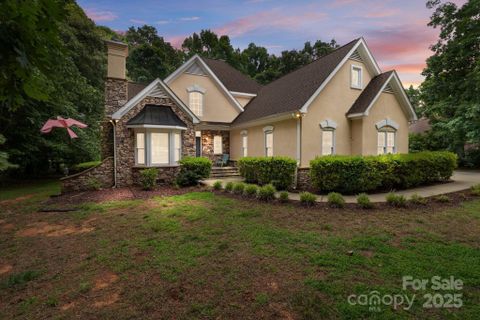
The built housing that does trade in Uwharrie Point points to a custom-home profile from the late 1990s through early 2000s. Closed home sales include detached residences built from 1997 to 2004, with features such as vaulted ceilings, screened porches, split-bedroom layouts, main-level primary suites, lower-level recreation space, and expansive lake-facing outdoor areas.
From Uwharrie Point, Charlotte, Greensboro, and Winston-Salem are each framed in listings as roughly an hour away, while Uwharrie National Forest is about 15 minutes from the gates for hiking, camping, horseback riding, and OHV access. School assignments are not consistently identified in the source records, so the location story here is driven more by Badin Lake, the club campus, and the surrounding forested shoreline than by a defined school narrative.
Uwharrie Point fits buyers seeking a gated Badin Lake setting where golf frontage, marina access, and generous homesites shape the identity of the community.
Palmetto Park Realty Team · Badin Lake
Ask about Uwharrie Point — we answer fast
See what it's worth — your home's own sale history plus recent Uwharrie Point sales, free.
What's my home worth?Communities similar to Uwharrie Point
19 recently sold in Uwharrie Point, Badin Lake
| Property | Sold | Sold Price | Days on Market | Size | Sold to Ask | Sold $/SF |
|---|---|---|---|---|---|---|
| | Jul 14 2026 | $15,500 | 253 | — | 88.6% | — |
| | Jun 12 2026 | $199,000 | 58 | — | 90.9% | — |
| | May 28 2025 | $14,750 | 391 | — | 87.3% | — |
| | Dec 11 2024 | $50,000 | 321 | — | 63.3% | — |
| | Oct 1 2024 | $282,000 | 186 | — | 97.6% | — |
| | Feb 20 2024 | $220,000 | 251 | — | 88.4% | — |
| | Sep 28 2023 | $44,000 | 146 | — | 81.5% | — |
| | Jun 9 2023 | $1,075,000 | 50 | 3,951 sq ft | 98.2% | $272 |
| | Jul 14 2022 | $20,000 | 28 | — | 66.9% | — |
| | Apr 18 2022 | $8,000 | 46 | — | 89.9% | — |
| | Sep 28 2021 | $12,500 | 76 | — | 89.9% | — |
| | Oct 22 2018 | $1,625,000 | 175 | 6,405 sq ft | 85.7% | $254 |
| | Mar 23 2018 | $295,000 | 81 | 2,566 sq ft | 98.4% | $115 |
| | Nov 2 2017 | $19,900 | 163 | — | 100.0% | — |
| | Jan 13 2017 | $10,000 | 3490 | — | 66.7% | — |
| | Apr 28 2016 | $800,000 | 1928 | 3,317 sq ft | 80.0% | $241 |
| | Oct 30 2015 | $12,000 | 517 | — | 100.0% | — |
| | Feb 27 2014 | $162,500 | 873 | 1,482 sq ft | 101.6% | $110 |
| | Sep 12 2013 | $55,000 | 1017 | — | 78.7% | — |
Closed sales from MLS history for Uwharrie Point, Badin Lake
Below trend-line threshold — city median shown for context
+1 outside price range.
The Uwharrie Point real estate market shows buyer's market conditions. Homes typically sell within 186 days. With 1 active listing and 2 homes sold in the past year, buyers have more negotiating power and time to decide.
Free account needed — create one to continue viewing homes.
Members see everything — free👋 Still browsing Uwharrie Point?
Full photos, price history, and every active & pending home in Uwharrie Point with a free account.
Palmetto Park Realty Team
 $34K
$34KCheck your messages
We sent a code to .
Verify your number and we'll text you price drops and new Uwharrie Point listings. 1–2 texts a month, stop anytime.
Enjoy full access to this home and every home on Palmetto Park.