Active
$95,000 $90/sqft
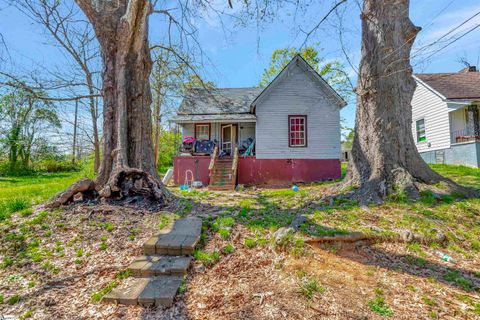
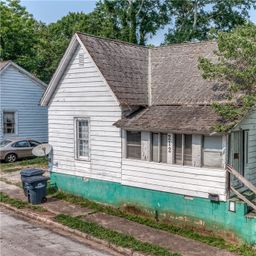
308 F Street
Anderson, SC 29625
2 bd · 1 ba · 1,060 sqft · 1 yr ago
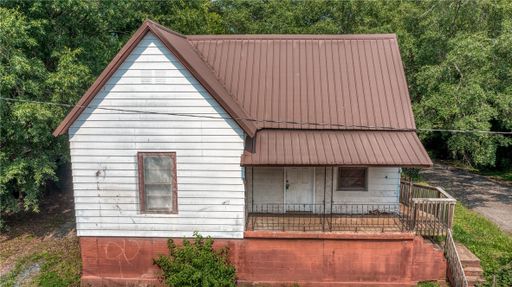
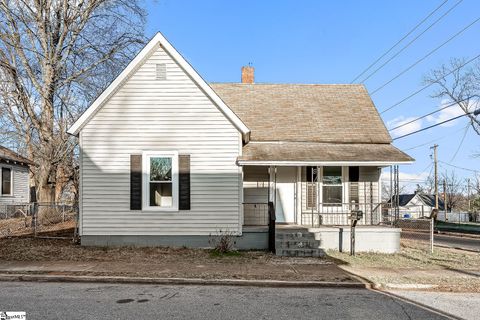
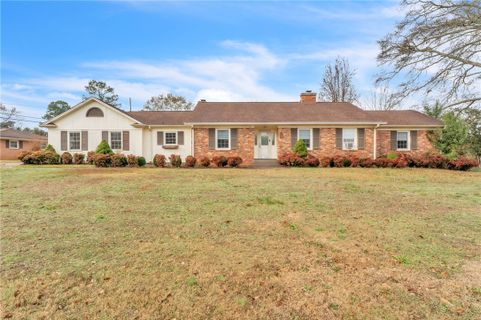
Abney Mills has the feel of a long-established Anderson neighborhood where the streets are laid out in a straightforward, no-fuss pattern and the homes sit on modest lots.
Community overview based on MLS listing data for Abney Mills, Anderson
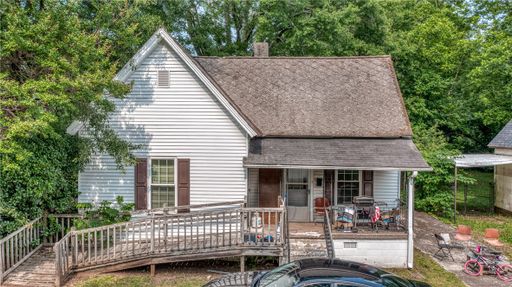
Abney Mills has the feel of a long-established Anderson neighborhood where the streets are laid out in a straightforward, no-fuss pattern and the homes sit on modest lots. It is the kind of place that feels rooted in the city’s older residential fabric, with many properties dating back decades and a few newer additions mixed in. The overall mood is practical and unpretentious, shaped by small single-family homes, simple front yards, and an address pattern that places everyday convenience close at hand.
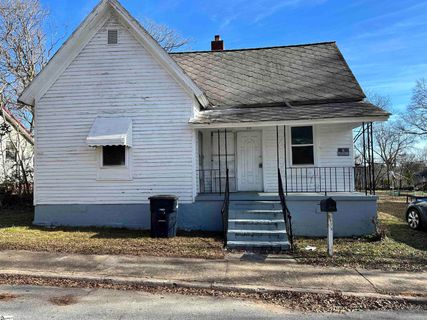
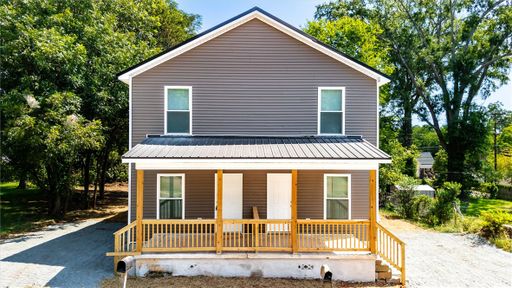
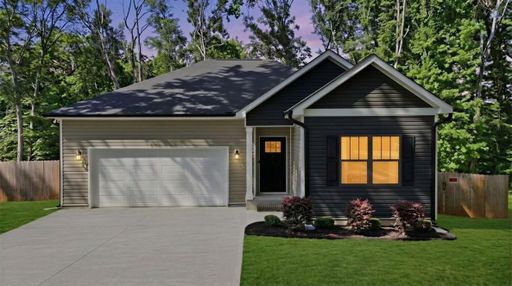
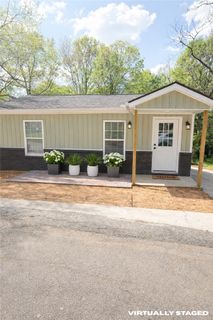
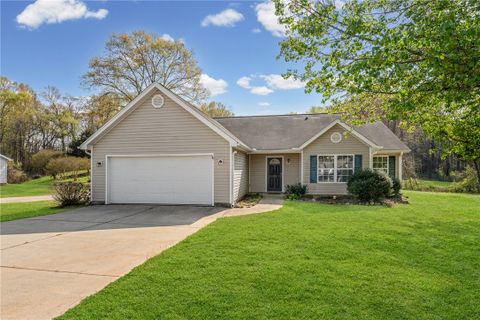
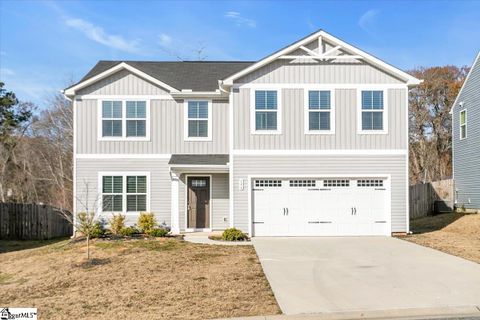
The housing here is primarily single-family residential, and the character leans toward compact homes rather than large-scale new construction. Many residences are two to four bedrooms with one bath or a little more, and the lot sizes are generally manageable, averaging just under a fifth of an acre. The oldest homes in the community reach back to 1900, while the newest recorded construction is 2024, so there is a real mix of vintage charm and occasional updated or newly built property. Renovated interiors, original hardwoods, front porches, fenced yards, and carports show up often in listing remarks, while some homes are offered as renovation opportunities or income-producing rentals. Garage space is uncommon, and basements are not part of the usual profile, which keeps the focus on straightforward main-level living.
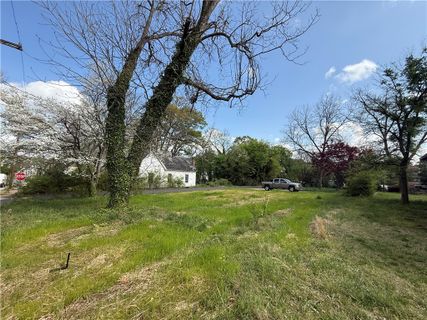
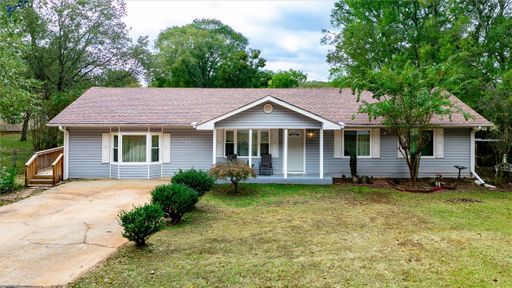
Life in Abney Mills is centered more on access than on private amenities. There is no HOA, and community features like pools or waterfront settings are not part of the picture. Instead, the appeal comes from the neighborhood’s flexibility and its connection to the broader Anderson market. Listings frequently highlight tenant occupancy, renovation potential, and portfolio opportunities, which points to a community with steady rental use alongside owner-occupied homes. Nearby streets and lots have room for porches, fenced backyards, and practical outdoor space, giving the neighborhood a lived-in, adaptable feel rather than a polished planned-development atmosphere.
Abney Mills sits in Anderson, close to downtown Anderson and the city’s everyday core. Public remarks place some homes just a 3-minute drive from downtown, while others are described as minutes away, and one listing notes easy access to Main Street in under 5 minutes for dining, shopping, and local activity. Linley Park is also mentioned as a nearby destination. School assignments commonly point to Whitehall Elementary, Lakeside Middle, and Westside High, with the Anderson school district serving the area. For buyers who want an in-town location with quick access to the center of Anderson, this neighborhood keeps the drive simple and the route familiar.
Palmetto Park Realty Team · Anderson
Ask about Abney Mills — we answer fast
See what it's worth — your home's own sale history plus recent Abney Mills sales, free.
What's my home worth?Communities similar to Abney Mills
 1.7 mi
 Evergreen Hills, Anderson
5 active · $210,000
 0.3 mi
 Appleton Mill V, Anderson
3 active · $69,500
 4.2 mi
 Stonewall Woods, Anderson
3 active · $295,000
 2.2 mi
 Casa Del Rio, Anderson
3 active · $244,900
 1.5 mi
 Bleckley Trail, Anderson
3 active · $290,000
 3.9 mi
 Centerville Terrace, Anderson
3 active · $235,000
42 recently sold in Abney Mills, Anderson
| Property | Sold | Sold Price | Days on Market | Size | Sold to Ask | Sold $/SF |
|---|---|---|---|---|---|---|
| | May 5 2026 | $65,000 | 34 | 976 sq ft | 100.0% | $67 |
| | May 15 2025 | $112,000 | 75 | 1,074 sq ft | 97.4% | $104 |
| | Apr 30 2025 | $17,500 | 27 | — | 87.5% | — |
| | Apr 23 2025 | $65,500 | 84 | 1,000 sq ft | 94.9% | $66 |
| | Oct 28 2024 | $260,000 | 59 | 2,576 sq ft | 92.9% | $101 |
| | May 13 2024 | $55,000 | 40 | 1,069 sq ft | 98.2% | $51 |
| | Apr 25 2024 | $165,000 | 77 | 1,950 sq ft | 91.7% | $85 |
| | Mar 29 2024 | $13,000 | 32 | 1,017 sq ft | 130.0% | $13 |
| | Feb 19 2024 | $15,000 | 206 | — | 93.8% | — |
| | Jun 21 2023 | $72,500 | 34 | 1,065 sq ft | 80.6% | $68 |
| | May 23 2023 | $75,000 | 16 | 931 sq ft | 100.0% | $81 |
| | Jan 26 2023 | $7,150 | 108 | — | 95.3% | — |
| | Aug 17 2022 | $113,000 | 169 | 968 sq ft | 95.0% | $117 |
| | Aug 17 2022 | $113,000 | 170 | 968 sq ft | 95.0% | $117 |
| | Jun 10 2022 | $45,000 | 36 | 1,079 sq ft | 90.2% | $42 |
| | Jul 22 2021 | $46,750 | 128 | 972 sq ft | 100.0% | $48 |
| | Jul 22 2021 | $46,750 | 128 | 946 sq ft | 100.0% | $49 |
| | Jul 22 2021 | $55,750 | 128 | 1,124 sq ft | 100.0% | $50 |
| | Jul 22 2021 | $53,750 | 128 | 1,114 sq ft | 100.0% | $48 |
| | Jul 22 2021 | $50,750 | 128 | 1,031 sq ft | 100.0% | $49 |
| | Aug 25 2020 | $19,000 | 123 | 1,760 sq ft | 97.4% | $11 |
| | Feb 28 2020 | $35,000 | 44 | 1,061 sq ft | 100.0% | $33 |
| | Feb 20 2020 | $10,000 | 20 | 999 sq ft | 100.0% | $10 |
| | Dec 17 2018 | $11,000 | 34 | 1,000 sq ft | 73.3% | $11 |
| | Aug 16 2018 | $35,000 | 99 | 1,900 sq ft | 100.0% | $18 |
| | Feb 26 2018 | $22,000 | 20 | 1,287 sq ft | 79.2% | $17 |
| | Dec 3 2017 | $131,000 | 211 | 1,000 sq ft | 100.0% | $131 |
| | Nov 12 2015 | $10,500 | 408 | 1,061 sq ft | 87.5% | $10 |
| | Sep 25 2015 | $9,000 | 22 | 1,488 sq ft | 150.0% | $6 |
| | Jul 3 2015 | $11,100 | 53 | 1,073 sq ft | 71.6% | $10 |
| | Jun 30 2015 | $16,500 | 57 | 1,000 sq ft | 82.9% | $17 |
| | Dec 5 2014 | $16,250 | 157 | — | 74.2% | — |
| | Dec 5 2014 | $16,250 | 157 | — | 74.2% | — |
| | Dec 5 2014 | $16,250 | 157 | — | 74.2% | — |
| | Dec 5 2014 | $16,250 | 157 | — | 74.2% | — |
| | May 15 2014 | $25,000 | 602 | — | 86.5% | — |
| | Mar 7 2014 | $6,000 | 321 | 976 sq ft | 60.6% | $6 |
| | Jun 24 2013 | $15,000 | 277 | — | 75.4% | — |
| | Apr 24 2013 | $9,900 | 215 | — | 100.0% | — |
| | Aug 6 2012 | $16,000 | 46 | — | 71.1% | — |
| | Feb 13 2012 | $3,500 | 311 | — | 53.8% | — |
| | Jan 12 2012 | $7,000 | 850 | — | 63.6% | — |
Closed sales from MLS history for Abney Mills, Anderson
Abney Mills median sale price is $55,000; Anderson is up 3.3%.
+3 outside price range.
The Abney Mills real estate market shows buyer's market conditions. Homes typically sell within 85 days. With 6 active listings and 1 home sold in the past year, buyers have more negotiating power and time to decide.
Free account needed — create one to continue viewing homes.
Members see everything — free👋 Still browsing Abney Mills?
Full photos, price history, and every active & pending home in Abney Mills with a free account.
Palmetto Park Realty Team
 $97K
$97K $95K
$95K $95K
$95K $95K
$95K $95K
$95K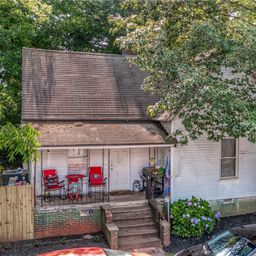 $95K
$95KCheck your messages
We sent a code to .
Verify your number and we'll text you price drops and new Abney Mills listings. 1–2 texts a month, stop anytime.
Enjoy full access to this home and every home on Palmetto Park.